
More Information
Submitted: October 15, 2025 | Approved: November 11, 2025 | Published: November 12, 2025
How to cite this article: Ergen H, Guleli M, Yılmaz M, Caliskan C. Characterization of Genotoxic Impurities with LC-QTOF and RP-HPLC Methods, Including Different Swab Methods in Cleaning Validation. Arch Case Rep. 2025; 9(12): 370-378. Available from:
https://dx.doi.org/10.29328/journal.acr.1001175
DOI: 10.29328/journal.acr.1001175
Copyright license: © 2025 Ergen H, et al. This is an open access article distributed under the Creative Commons Attribution License, which permits unrestricted use, distribution, and reproduction in any medium, provided the original work is properly cited.
Keywords: Cleaning agent; Cleaning validation; Method development; Method validation; Propyl benzene sulfonate

Characterization of Genotoxic Impurities with LC-QTOF and RP-HPLC Methods, Including Different Swab Methods in Cleaning Validation
Harun Ergen , Muge Guleli, Melise Yilmaz* and Cem Caliskan
World Medicine Pharmaceutical Industry and Trade Inc. R&D Center, 15 Temmuz Mah. Cami Yolu Cad. No: 50 K: 4 Günesli, Istanbul, Turkey
*Address for Correspondence: Cem Caliskan, World Medicine Pharmaceutical Industry and Trade Inc. R&D Center, 15 Temmuz Mah. Cami Yolu Cad. No: 50 K: 4 Günesli, Istanbul, Turkey, Email: [email protected]
While cleaning agents used in cleaning validation studies eliminate product residues, they can create another contamination with their own residues. This study aims to develop a new, more economical, and easy-to-apply strategy that can achieve sharp peaks by using the UV-RP-HPLC method in cleaning validation studies on different surfaces and the swab method in cleaning validation studies. The content of the cleaning agent used in cleaning validation studies was characterized by mass spectroscopy (LC-QTOF-MS). According to the International Council for Harmonization, a new, easy-to-apply method for propylbenzene sulfonate detected in the cleaning agent composition was developed and verified by the UV-RP-HPLC method. PMMA, POM, Teflon, and glass plate surfaces were used for the swab method. The residue limit was calculated at 71.4 µg/mL. The absence of any cleaning validation studies using specific plate surfaces such as PMMA, POM, Teflon, and glass for propyl benzene sulfonate as a genotoxic impurity, characterized by LC-QTOF-MS and swab method in the current literature, supports the innovative contribution of our study. Validated according to the ICH Q2 (R1) guideline, this method showed linearity, precision, accuracy, solution stability, and system suitability results within acceptance criteria.
In recent years, cleaning validation studies have become increasingly important in the pharmaceutical industry. Cleaning the production equipment is necessary to remove the active and inactive residues of the product produced in the equipment used and the chemical and microbial qualities of the detergent components used for cleaning [1-3].
Although the cleaning validation study may seem like a multi-parameter, tiring, and long process at first glance, it reduces the risk in production and minimizes the costs that may arise. The advantages of the cleaning validation study are the identification and prevention of efficacy, safety, or previously unsuspected problems before production within the equipment. Today, current Good Manufacturing Practice (cGMP) guidelines state that cleaning methods must be applied to every process related to the distribution and storage of manufactured pharmaceutical products. The U.S. Food and Drug Administration (FDA) announces that approved protocols have been prepared for the work to be done on the device and for each manufacturing system [4-7].
Equipment used in drug production can be used for more than one product. Therefore, residue limits for equipment used in cleaning validation should be acceptable [1].
The swab method used in cleaning validation studies is one of the sampling methods used on the plates used in production equipment. It is based on the physical removal of residual product or cleaning agent residues from production equipment. Careful selection of the surfaces to be sampled and the absence of any abrasions or cracks on the surfaces are among the issues to be considered. During the cleaning application, the previously working product remaining in the equipment, other substances, and cleaning agents from outside may produce contaminated products [5]. Acceptable limits are related to parameters such as total equipment area, batch size, and maximum dose of the next product. Therefore, each method creates its limits [8-11].
An analytical strategy should be developed to determine the amount of cleaning agent residue left on the surfaces as a result of the cleaning process applied to the equipment surfaces. Since cleaning agents do not have any therapeutic dose in humans, such as drugs, a worst-case scenario can be used to determine the residue limit. In the worst-case scenario, the confidence interval of the product should be calculated by considering features such as resolution, the limit of detection, the total area of contact with the product, and minimum batch size [12,13].
Surfactants are molecules whose surface viscosity and surface tension can be measured in electrical potential differences between phases. Alkyl sulfonates are a class of anionic surfactants. Because the sulfonate anion is a good leaving group, alkyl sulfonates are generally known as alkylating agents and so are direct-acting mutagens not requiring metabolic activation [14]. Exposure to alkyl sulfonates can cause DNA damage. Moreover, a large number of DNA mutations may occur, and such esters have been shown to exert genotoxic effects [15-16]. Generic/compound-specific limits for alkyl sulfonates and considerably higher limits for chloroalkanes can be derived using the available toxicological data and provisions of the International Conference on Harmonization (ICH) M7 guideline [14,17-19].
The cleaning agent selected according to the residue limits determined for the equipment used in drug production is essential in the cleaning validation studies. Because the residues and contaminations formed on the equipment surface are removed with cleaning agents. Thus, it will help to develop a simpler system to implement for cleaning validation work [5-7].
While cleaning agents used in cleaning validation studies eliminate product residues, they can create another health concern [4]. It is necessary to investigate and compare the methods routinely used to quantify plasticizers in plastic products with updated, more efficient extraction and analysis approaches. Furthermore, allowable concentration limits are continuously decreasing, and the performance of these methods at these lower concentrations needs to be evaluated. Although researchers have investigated the extraction of phthalates from PVC, limited information is available on the rapid extraction and quantification of phthalates at concentration levels that are ten times below the regulated limit.
This study aims to determine propyl benzene sulfonate, which is a genotoxic impurity, by using the RP-HPLC method and UV detector in cleaning validation studies, and to develop a more economical and easily applicable new method by using specific surfaces such as Poly(methyl methacrylate) (PMMA), Polyoxymethylene (POM), Teflon, and glass, and the swab method. In addition, while removing genotoxic impurities contained in the cleaning agents taken by the swab method, it evaluates the situation of creating another cross-contamination with its residues.
Potassium chloride was supplied by J.T. Baker. Ammonium acetate and ammonium dihydrogen phosphate were supplied by Scharlau. Methanol was taken from Merck. The Sartorius Stedim Biotech system produced HPLC-grade water (0.05 µc). PMMA, Teflon, glass, and POM surfaces were made of 304 unpolished materials and have dimensions of 25 cm × 25 cm. Swap sticks were purchased from Texwipe TX714A. PMMA, Teflon, glass, and POM plate surfaces used in this study have been studied since they are the surfaces used in production equipment and are in direct or indirect contact with the product produced.
LC-QTOF-MS procedure
A liquid chromatography quadrupole time-of-flight mass spectrometer (Agilent Q-TOF-MS 6546) equipped with an ESI source consisting of a 1290 series HPLC instrument (Agilent Technologies, USA) was used to identify the main component of the cleaning agent. The chromatographic separation was completed on an X Terra MS C18 column (150 × 3.0 mm, 3.5 µm) using a mobile phase of 5 mM Ammonium acetate (for negative scanning), 5 mM Ammonium formate (for positive scanning), and methanol with gradient elution at a flow rate of 0.4 ml/min within 30.0 min. The typical operating source conditions for MS scan in positive and negative ion ESI modes were optimized; the capillary voltage was 3500 V; the skimmer at 65 V; nitrogen was used as the drying (400⁰C; 8 l/min) and nebulizer (35 psi) gas. The mass spectra were recorded across the range of m/z 100–1100 for both positive and negative ion modes. Nitrogen was kept as a nebulizer and auxiliary gas. The data acquisition was carried out by Mass Hunter workstation software.
HPLC assay method procedure
A 75:25 (v: v) ratio of 0.3 M potassium chloride: methanol mixture was used as the mobile phase. The analysis was carried out on the Waters E2695 HPLC system. The analysis was conducted on an analytical column ZORBAX ECLIPSE XDB-C8 5 μm, 150 × 4.6 mm. The column temperature is 40 °C, and the wavelength is 215 nm. The injection used was a volume of 100 µl and the flow rate of 2.0 ml/min. The run time was 15 minutes.
Stock cleaning agent sample preparation solutions
35.70 mg of cleaning agent is accurately weighed and transferred into a 25 ml volumetric flask. It is completed with purified water to volume and mixed well. It is mixed for 15 min in a magnetic mixer with the help of a fish, and attention is paid to its foaming.
Cleaning agent sample preparation solutions
A 500 µl of cleaning agent sample is placed on each plate and allowed to dry. 100 cm2 of the related surface is swabbed down with 3 swab sticks. For this process, 250 µl of purified water is added to each surface of the first and second swab sticks. The relevant surface area is scanned with one side of the swab stick from right to left and the other side from top to bottom, and the tip of the swab stick is cut and transferred to the glass tube. The wet surface is dried completely with the third swab, the tip is cut, and transferred to the glass tube. Then, 9.0 ml of purified water is added to a glass tube and vortexed for 1 min. It is filtered through a 0.45 µm RC filter and filled into HPLC vials.
Determination of residue limit
In determining the residue limits, the product produced in the same equipment, batch size, and equipment properties is an important consideration. While calculating the residual for each manufactured product, the calculation is made by considering the maximum dose, batch size, and total equipment surface area of the next product to be produced. It is very important to determine the cleaning agent’s content before determining the cleaning agent’s residue limits. Because acidic agents or strongly alkaline agents are detected by pH measurement, ionic agents by conductivity measurement of residues, and agents containing large amounts of surfactants by visual residue limits [20-22].
Where:
ARL: Acceptable residue level (ppm or mg)
PDE: Permitted Daily Exposure
J: Largest daily dose of the next product
K: The smallest batch size of any product made in the same equipment
ARL = 1500 mg
The maximum Acceptable Residue Level amounts on the 100 cm2 surface of manufacturing equipment:
ARL: Acceptable residue level (ppm or mg)
SA: Swab Surface Area
Y: Total Surface Area
CF: Conversion factor of mg to µg, (1000)
LC-QTOF-MS procedure
When choosing a method for detecting residues of cleaning agents, it is very important to know the properties of the substance. The most important problem with the use of cleaning agents is the ignorance of their components. The formulations of the cleaning agents are not disclosed to avoid duplication by different manufacturers. In the current literature, no study was found in which the characterizations of cleaning agents were determined using the LC-QTOF-MS system. For this reason, the cleaning agent used in the cleaning of the production equipment was given to the LC-QTOF-MS system to identify the components. It has been determined that there was no ionization in a negative mode in both positive and negative mode injections. The chromatogram, in which ionization was detected selectively in positive mode, contains a single peak, and its spectrum is given in Figure 1. As seen in Figure 1, the m/z for this peak was determined as 199.0436, and this ion was formulated as [M-H]- = [[C9H12O3S]-H]- with a score of 99.28%. Identifying compounds is achieved with the help of matches and scores based on correct mass matching, isotope abounds, ance, and isotope ratio matching. The Mass score, which expresses the closeness of the mass to the theoretical mass, was 99.84, and the scores for Isotope abundance and isotope range, which depend on the composition of the formula, were 98.18 and 99.47, respectively. An individual score of >97% indicates a correct match. As can be seen in Figure 2, it has been determined that this closed formula belongs to propyl benzenesulfonate, one of the alkyl benzene sulfonates commonly used as a cleaning agent, with high scores obtained. Method development and method validation studies were carried out on the detected propylbenzene sulfonate.
Figure 1: Chemical structure of a potential genotoxic impurity of sulfonate esters.
Development of the chromatographic method
A new method has been developed for the surfactant used as a cleaning agent to obtain a sharp and symmetrical peak and to detect very low residue limits in the HPLC system. For this purpose, ODS-3V and ACE columns with different fillers such as C8 and C18 were used. Examined by an isocratic method by applying a mixture of methanol and 0.2 M ammonium dihydrogen phosphate (40/60, v/v) as, mobile phase. Flow rate 1.0 ml/min; The UV detector was used at 30 ºC column temperature and λ = 215 nm. The mobile phase, flow rate, wavelength, and column temperature were kept constant. In the ODS-3V and ACE C-18 columns used in the first trial study, it was observed that the precipitates caused by salt formation blocked the columns (Figure 2a). A more specific column, ZORBAX ECLIPSE XDB-C8, was used for the column assay. Based on the optimization, the C8 column with 5.0 m particle size and 150 mm ZORBAX ECLIPSE XDB-C8 column length was found ideal.
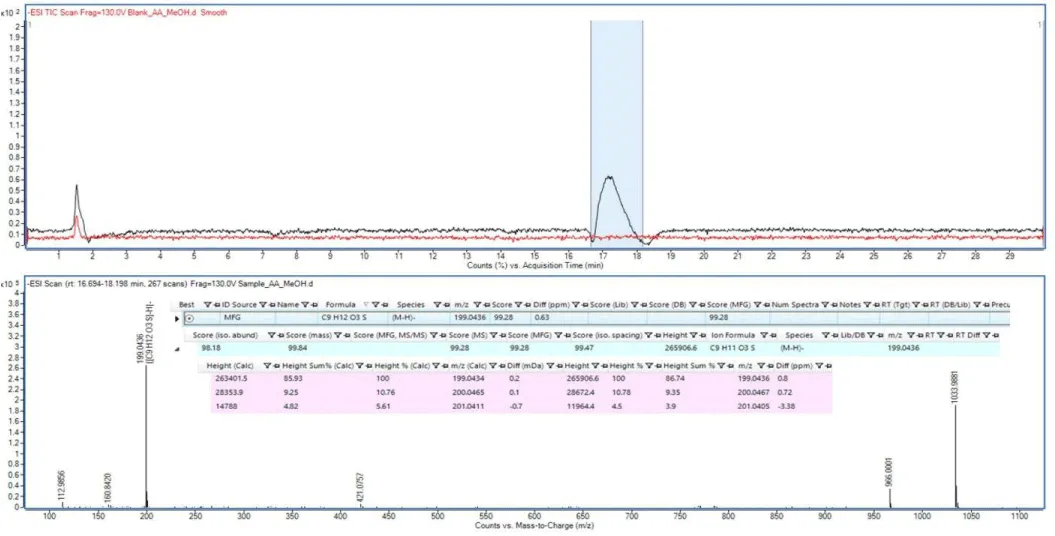
Figure 2: LC-QTOF-MS scan result for cleaning agent (Propyl benzenesulfonate).
After the ideal column was determined, mobile phase experiments were carried out by keeping the mobile phase flow rate 1.0 ml/min, the column temperature constant at 30 ºC, and λ = 215 nm. Buffer solutions prepared from different salts such as ammonium dihydrogen phosphate, potassium dihydrogen phosphate, ammonium acetate, and organic solvents such as methanol and acetonitrile were tested. In most of these cases, such as precipitation in the buffer, accumulation in the column, or failure to achieve peak symmetry, were encountered. A representative chromatogram obtained from a 0.5 M ammonium dihydrogen phosphate and methanol mixture (80/20, v/v) is given in Figure 2b. In the last experiment, a 0.3 M potassium chloride: methanol mixture at a ratio of 75:25 (v: v) was used as the mobile phase. It was studied at a flow rate of 1.0 ml/min and a column temperature of 40 ºC. The wavelength was set to 215 nm. Since potassium chloride has a high solubility in water, it did not cause any collapse in the column, and the best peak symmetry was determined in studies with this salt. To support this, accurate chromatograms of PMMA, Teflon, glass, and POM plate surfaces used in the study are given in Figure 3c-f (Table 1).
| Table 1: HPLC methods for the estimation of sulfonate esters. | |||||
| 1 | 2 | 3 | 4 | 5 | |
| Mobile Phase Composition | MeOH: 0.2 M NH4H2PO3 (40/60, v/v) | MeOH: 0.2 M NH4H2PO3 (40/60, v/v) |
MeOH: 0.2 M NH4H2PO3 (40/60, v/v) |
MeOH: 0.5 M NH4H2PO3 (20/80, v/v) |
MeOH: 0.3 M KCl (25/75, v/v) |
| Flow Rate | 1 mL/min | 1 mL/min | 1 mL/min | 1 mL/min | 1 mL/min |
| Mode of analysis | Isocratic | Isocratic | Isocratic | Isocratic | Isocratic |
| Column Type | ODS-3V C18 | ACE C8 | Zorbax Eclipse XDB-C8 | Zorbax Eclipse XDB-C8 | Zorbax Eclipse XDB-C8 |
| Column Specification | 150 mm x 4.6 mm x 5µm | 150 mm x 4.6 mm x 5µm | 150 mm x 4.6 mm 5µm | 150 mm x 4.6 mm 5µm | 150 mm x 4.6 mm 5µm |
| Column Temperature | 30 oC | 30 oC | 30 oC | 30 oC | 40 oC |
| Detector | UV | UV | UV | UV | UV |
| Wavelength | 215 nm | 215 nm | 215 nm | 215 nm | 215 nm |
Method validation
Different validation parameters of the proposed method, such as system suitability, precision, solution stability, accuracy, linearity, and intermediate precision, were validated according to the ICH Q2 (R1) guideline [12].
System suitability: The system suitability acceptance criteria of the cleaning agent at a concentration of 71.4 µg/ml were determined from six repetitive injections. For the acceptance criteria, the theoretical plate number was more than 3000, and the EP symmetry factor was not more than 2.0 (Figure 4).
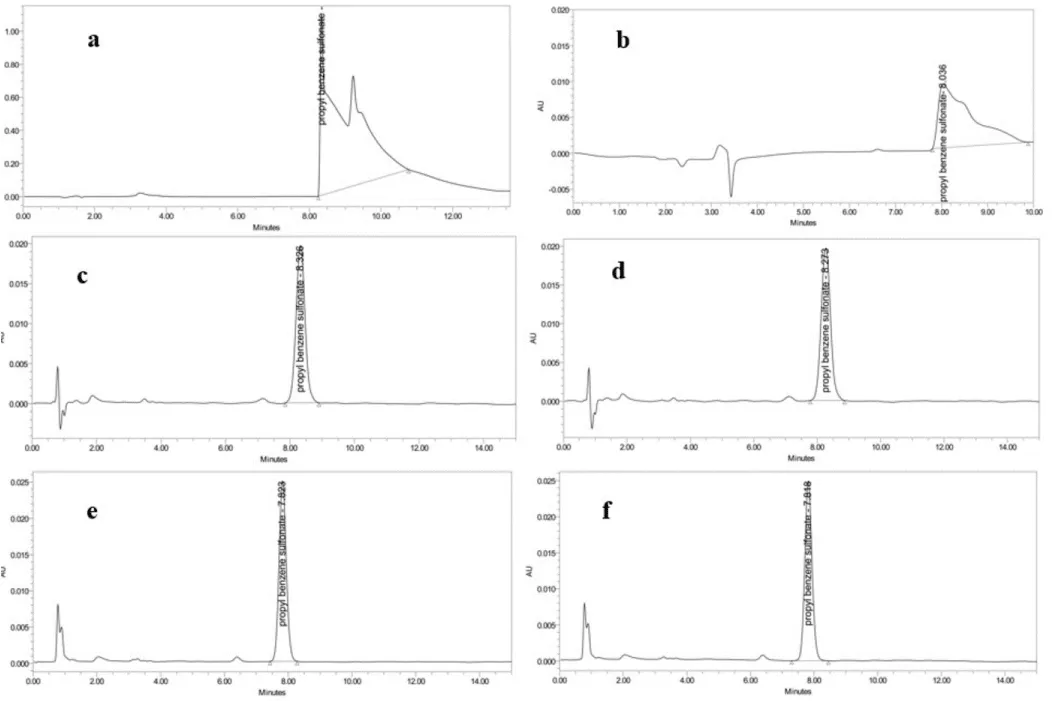
Figure 3: Chromatograms showing: a) Chromatogram of the study using ODS 3V column and 0.2 M ammonium dihydrogen phosphate, b) Chromatogram of 0.5 M potassium dihydrogen phosphate buffer, c) PMMA surface Accuracy sample chromatogram, d) Teflon surface Accuracy sample chromatogram, e) Glass surface Accuracy sample chromatogram, f) POM surface Accuracy sample chromatogram.
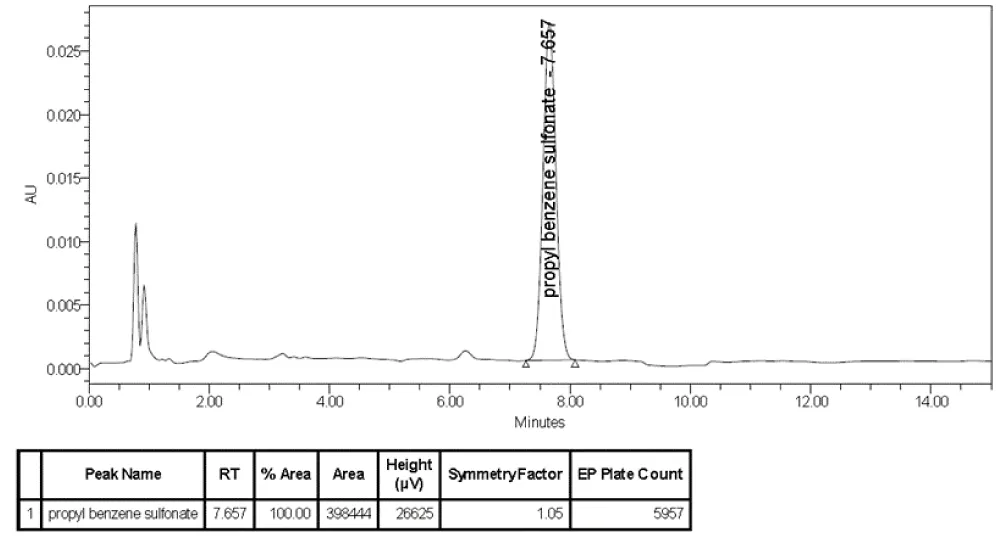
Figure 4: System suitability chromatogram.
LOD/LOQ
For LOD, the signal-to-noise ratio was 3:1, and the LOQ signal-to-noise ratio was 10:1. The LOD was 3.51, and the LOQ was 10.58 for the cleaning agent. Values were given in Table 2.
| Table 2: LOQ-LOD results of the method. | ||
| Conc, µg/mL | Signal-to-noise ratio | |
| LOQ | 0.8925 | 10.38 |
| LOD | 0.2975 | 3.51 |
Linearity: The linearity of the analytical method is determined by the direct comparison of results with the analyte concentration within the specified ratios. The linearity graph for the cleaning agent is shown in Figure 5. Thirteen different (0.89 - 171 µg/ml) concentrations were prepared. The specification limit (71.40 µg/ml) was injected six times, other twelve concentrations were injected three times. As a result of the study, a linear equation was obtained from the regression analysis, and it was determined that the correlation coefficient (r) met the acceptance criteria of r ≥ 0.99. Using the linearity curve obtained from the solutions prepared during the validation study, r was found as 0.999.
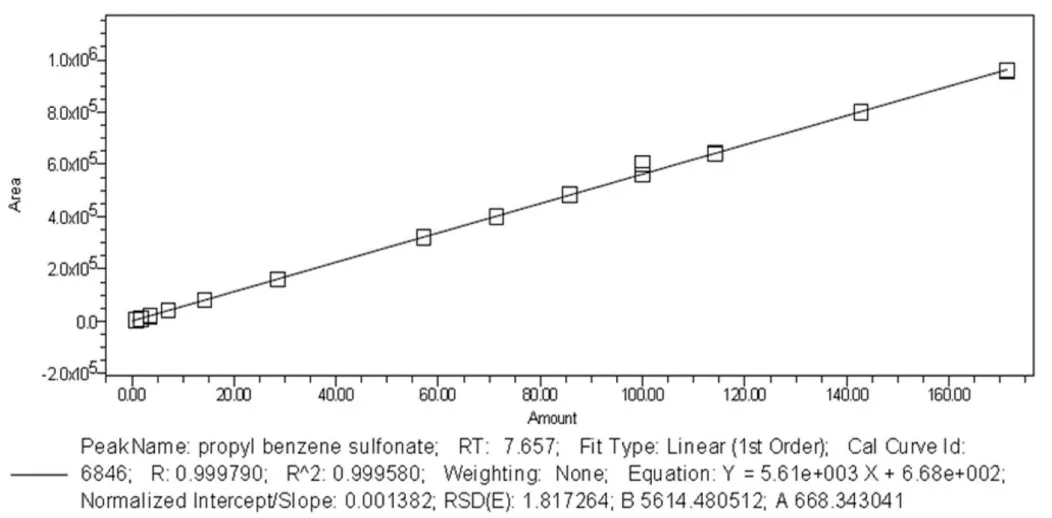
Figure 5: Linearity graph.
Accuracy: Under optimum conditions, the accuracy of the cleaning agent was evaluated by recoveries. Recovery solutions were prepared with LOQ, 80, 100, 120, and 200% of the specification limit. Prepared solutions of the five concentrations (LOQ, 80, 100, 120, and 200%) were each injected three times. The 100% concentration (71.40 µg/ml) and the LOQ (0.89 µg/ml) concentrations were injected six times. The recovery results of all plates met the acceptance criteria, ranging from LOQ to 200%. The accuracy table obtained is given in Table 3.
| Table 3: PMMA, Teflon, glass, and POM plate accuracy results of the method. | ||||||||
| LEVEL | PMMA | TEFLON | GLASS | POM | ||||
| Average Accuracy, % |
RSD, % | Average Accuracy, % |
RSD, % | Average Accuracy, % |
RSD, % | Average Accuracy, % |
RSD, % | |
| LOQ | 96.26 | 1.75 | 97.74 | 1.66 | 98.24 | 1.21 | 97.42 | 1.81 |
| 80% | 93.11 | 0.13 | 101.47 | 0.87 | 101.51 | 0.22 | 102.65 | 0.02 |
| 100% | 96.01 | 0.09 | 94.91 | 0.22 | 96.26 | 0.34 | 95.69 | 0.45 |
| 120% | 101.82 | 0.29 | 101.79 | 0.35 | 102.21 | 0.24 | 102.01 | 0.11 |
| 200% | 101.57 | 0.13 | 101.20 | 0.22 | 101.76 | 0.12 | 101.78 | 0.13 |
System, method, and intermediate precision: System precision was studied by giving six consecutive injections of the working standard at the specification limit. For cleaning agents containing propyl benzene sulfonate, the RSD is calculated as 0.04%. Precision and intermediate precision parameters were studied by injecting six separate plate samples. As a result of the studies carried out by 2 different analysts on 2 different devices and on different days, it was evaluated whether the limit range of 80% - 120% and RSD ≤10% met the acceptance criteria with their percentage recovery. For every known contamination. Sensitivity tables and representative chromatograms are given in Table 4. Precision representative chromatograms were given in the
| Table 4: Precision and Intermediate Precision results of the method. | ||||
| Plate Surface | Precision average, % | Precision RSD, % | Intermediate Precision Average, % | Intermediate Precision RSD, % |
| PMMA Plate | 100.66 | 0.16 | 94.88 | 0.46 |
| Teflon Plate | 100.45 | 0.65 | 98.26 | 1.94 |
| Glass Plate | 97.25 | 0.14 | 96.36 | 1.86 |
| POM Plate | 98.11 | 0.63 | 95.68 | 0.91 |
Statistical evaluation: The relationship between precision and intermediate precision, which is one of the cleaning validation parameters, was investigated by chemometric methods. The difference between the variances of the precision and intermediate precision results obtained in each plate was analyzed statistically by ANOVA F-test. The F values were obtained depending on the 95% confidence interval (a 0.05), and the degrees of freedom were determined to be greater than 1. According to the relationship between F and F critical, a t-test was applied. F-test results obtained in precision and intermediate precision parameters were found to be F ≥ 1 and F < F critical two-tailed (Tables 5-8). Results of the precision and intermediate precision parameters are equivalent due to| t Stat | ≤ t critical two-tailed.
| Table 5: F- and t-test results of precision and intermediate precision for the PMMA plate. | ||||||
| F-test: Two samples for variances | t-Test: Two samples assuming equal variances | |||||
| Precision Results | Intermediate Precision Result | Precision Results | Intermediate Precision Result | |||
| Mean | 100.49 | 95.18 | Mean | 100.49 | 95.18 | |
| Variance | 0.21 | 0.173 | Variance | 0.21 | 0.173 | |
| Observation | 6 | 6 | Observation | 6 | 6 | |
| df | 5 | 5 | Cumulative Variance | 0.19 | ||
| F | 1.24 | Predicted Mean Difference | 0 | |||
| P(F<=f) one-tailed | 0.41 | df | 10 | |||
| F Critical two-tailed | 5.05 | t Stat | 20.89 | |||
| P(T<=t) one-tailed | 0.00 | |||||
| t Critical one-tailed | 1.37 | |||||
| P(T<=t) two-tailed | 0.00 | |||||
| t Critical two-tailed | 1.81 | |||||
| Table 6: F- and t-test results of precision and intermediate precision for the POM plate. | ||||||
| F-test: Two samples for variances | t-Test: Two samples assuming equal variances | |||||
| Precision Results | Intermediate Precision Result | Precision Results | Intermediate Precision Result | |||
| Mean | 99.70 | 95.68 | Mean | 99.70 | 95.68 | |
| Variance | 1.13 | 0.76 | Variance | 1.13 | 0.76 | |
| Observation | 6 | 6 | Observation | 6.00 | 6 | |
| df | 5 | 5 | Cumulative Variance | 0.94 | ||
| F | 1.49 | Predicted Mean Difference | 0.00 | |||
| P(F<=f) one-tailed | 0.34 | df | 10.00 | |||
| F Critical two-tailed | 5.05 | t Stat | 7.16 | |||
| P(T<=t) one-tailed | 0.00 | |||||
| t Critical one-tailed | 1.37 | |||||
| P(T<=t) two-tailed | 0.00 | |||||
| t Critical two-tailed | 1.81 | |||||
| Table 7: F- and t-test results of precision and intermediate precision for the Teflon plate. | ||||||
| F-test: Two samples for variances | t-Test: Two samples assuming equal variances | |||||
| Precision Results | Intermediate Precision Result | Precision Results | Intermediate Precision Result | |||
| Mean | 98.26 | 99.91 | Mean | 99.91 | 98.26 | |
| Variance | 3.64 | 0.74 | Variance | 0.74 | 3.64 | |
| Observation | 6 | 6 | Observation | 6.00 | 6 | |
| df | 5 | 5 | Cumulative Variance | 2.19 | ||
| F | 4.95 | Predicted Mean Difference | 0 | |||
| P(F<=f) one-tailed | 0.05 | df | 10 | |||
| F Critical two-tailed | 5.05 | t Stat | 1.93 | |||
| P(T<=t) one-tailed | 0.04 | |||||
| t Critical one-tailed | 1.37 | |||||
| P(T<=t) two-tailed | 0.08 | |||||
| t Critical two-tailed | 1.81 | |||||
| Table 8: F- and t-test results of precision and intermediate precision for the Glass plate. | ||||||
| F-test: Two samples for variances | t-Test: Two samples assuming equal variances | |||||
| Precision Results | Intermediate Precision Result | Precision Results | Intermediate Precision Result | |||
| Mean | 96.14 | 100.22 | Mean | 100.22 | 96.14 | |
| Variance | 4.45 | 1.46 | Variance | 1.46 | 4.45 | |
| Observation | 6 | 6 | Observation | 6 | 6 | |
| df | 5 | 5 | Cumulative Variance | 2.96 | ||
| F | 3.04 | Predicted Mean Difference | 0.00 | |||
| P(F<=f) one-tailed | 0.12 | df | 10.00 | |||
| F Critical two-tailed | 5.05 | t Stat | 4.11 | |||
| P(T<=t) one-tailed | 0.00 | |||||
| t Critical one-tailed | 1.37 | |||||
| P(T<=t) two-tailed | 0.00 | |||||
| t Critical two-tailed | 1.81 | |||||
Solution stability: The stability of all plates was checked by comparing the peak areas obtained after 24 and 48 hours at room temperature and 5 °C with the peak areas found at baseline. It was controlled whether it met the acceptance criteria < 10% limit by calculating the % change in the peak areas. It was determined that both the standard solution and the sample solution were stable for 48 hours in the room and the refrigerator given in the
The most important point in cleaning validation work is to adopt a risk-oriented approach and minimize risks. The cleaning agents used in the cleaning of the equipment in drug products should be selected by considering their low toxicity, ease of application, and the structure of the surface materials of the equipment used in production. As a result of the cleaning process applied to the surfaces of the equipment used in the production of drugs, the cleaning agent residues mustn’t be left on the surface of the equipment. It is important to know the components of the cleaning agent used to prevent this contamination [9].
Considering the existing literature studies, Li, et al. studied a total organic carbon (TOC)-based method to measure residues of the CIP cleaning agent. The TOC method catalytically burns the organic substances in the water into CO2 by burning them at high temperatures, and the total amount of organic carbon in the sample is determined by measuring the released CO2. The method used in the study is a non-specific test method that recognizes the physical and chemical nature of the cleaning agent but does not recognize the sought-after component alone [17].
This review highlights the analysis of the genotoxic impurity by the LC-QTOF-MS and UV-RP-HPLC method. In our study, the cleaning agent used in the cleaning of production equipment was characterized by the LC-QTOF-MS system. The absence of an up-to-date UV-RP-HPLC method for propyl benzene sulfonate detected in the composition of the cleaning agent makes our study both safe and innovative. In addition, by applying the swab method on specific surfaces such as PMMA, POM, Teflon, and glass used in this study, it was evaluated whether propyl benzene sulfonate created any other contamination with its residue while removing the product residues. This developed and validated method is also suitable for quality control analyses as it is economical, easy to apply, and allows for obtaining sharp peaks in a short working time.
This work was supported by the World Medicine Pharmaceutical Industry and Trade Inc. The authors are thankful to the company for providing the necessary instrumental facilities and chemicals to carry out the research work.
- Zayas J, Colon H, Garced O, Ramos LM. Cleaning validation 1: development and validation of a chromatographic method for the detection of traces of LpHse detergent. J Pharm Biomed Anal. 2006;41:589–593. Available from: https://doi.org/10.1016/j.jpba.2005.10.049
- Parabu SL, Suriyaprakash TNK. Cleaning validation and its importance in pharmaceutical industry. Pharma Times. 2010;42:620–624. Available from: https://www.researchgate.net/publication/281742872_cleaning_validation_and_its_importance_in_pharmaceutical_industry
- Ghosh A, Dey S. Overview of cleaning validation in pharmaceutical industry. Int J Pharm Qual Assur. 2010;2:26–30. Available from: https://www.researchgate.net/publication/286331514_Overview_of_Cleaning_Validation_in_Pharmaceutical_Industry
- Resto W, Hermández D, Rey R, Colón H, Zayas J. Cleaning validation 2: development and validation of an ion chromatographic method for the detection of traces of CIP-100 detergent. J Pharm Biomed Anal. 2007;44:265–269. Available from: https://doi.org/10.1016/j.jpba.2007.01.037
- Walsh A. Cleaning validation for the 21st century. Acceptance limits for active pharmaceutical ingredients (APIs): Part I. Pharm Eng. 2011;4. Available from: https://www.researchgate.net/publication/262875575_Cleaning_Validation_for_the_21_Century_Acceptance_Limits_for_Active_Pharmaceutical_Ingredients_APIs_Part_I
- Wolkoff P, Schneider T, Kildesø J, Degerth R, Jaroszewski M, Schunk H. Risk in cleaning: chemical and physical exposure. Sci Total Environ. 1998;215:135–156. Available from: https://doi.org/10.1016/s0048-9697(98)00110-7
- Milenovic DM, Pesic DS, Mitic SS. Non-specific methods for detecting residues of cleaning agents during cleaning validation. Chem Ind Chem Eng Q. 2011;17:39–44. Available from: https://doi.org/10.2298/CICEQ100524051M
- Yirun A, Erkekoğlu P, Gumusel BK. Cleaning validation and toxicological evaluation of residue levels in pharmaceutical manufacturing. J Lit Pharm Sci. 2018;7:227–236. Available from: https://doi.org/10.5336/pharmsci.2018-61200
- U.S. Food and Drug Administration. Guide to inspections of validation of cleaning processes. 2014. Available from: https://www.fda.gov/validation-cleaning-processes-793
- Health Canada. Cleaning validation guidelines (GUIDE-0028). 2008. Available from: https://assets.ctfassets.net/a44nqpvb9zjg/78mndAlqro9UU1jGjZFZ9f/590f73df600ae18473ae2d7f23805f85/Health_Canada_GUI-0028_EN.pdf
- Govind RP, Kant ARK, Tanuj J, Dheeraj B. A review on cleaning validation in pharmaceutical industry. J Drug Deliv Ther. 2018;8:138–146. Available from: https://jddtonline.info/index.php/jddt/article/view/1695
- International Council for Harmonisation of Technical Requirements for Pharmaceuticals for Human Use (ICH). Q2(R1) validation of analytical procedures: text and methodology. Current Step 4 version, parent guideline dated 27 October 1994. Available from: https://database.ich.org/sites/default/files/Q2%28R1%29%20Guideline.pdf
- Manu C, Gupta NV. Review on cleaning validation in pharmaceutical industry. Int J PharmTech Res. 2016;3:415–421. Available from: https://sphinxsai.com/2016/ph_vol9_no3/2/(415-421)V9N3PT.pdf
- Snodin DJ, Teasdale A. Mutagenic alkyl-sulfonate impurities in sulfonic-acid salts: reviewing the evidence and challenging regulatory perceptions. Org Process Res Dev. 2015;19(11):1465–1485. Available from: https://pubs.acs.org/doi/abs/10.1021/op500397h
- Elder DP, Snodin DJ. Drug substances presented as sulfonic acid salts: overview of utility, safety and regulation. J Pharm Pharmacol. 2009;61:269–278. Available from: https://doi.org/10.1211/jpp/61.03.0001
- Firke SD, Kasar SR, Shirkhedkar AA, Sonar VP. Analysis of alkyl, aryl sulphonate ester – genotoxic impurities (GIS) in active pharmaceutical ingredient (API’s) and drug product. Am J PharmTech Res. 2020;10(3). Available from: https://www.ajptr.com/
- Liu L, Pack BW. Cleaning verification assays for highly potent compounds by high performance liquid chromatography mass spectrometry: strategy, validation, and long-term performance. J Pharm Biomed Anal. 2007;43:1206–1212. Available from: https://doi.org/10.1016/j.jpba.2006.10.008
- Arayne MS, Sultana N, Sajid SS, Ali SS. Cleaning validation of ofloxacin on pharmaceutical manufacturing equipment and validation of desired HPLC method. PDA J Pharm Sci Technol. 2008;62:353–361. Available from: https://pubmed.ncbi.nlm.nih.gov/19055231/
- Yildirim F, Ekmekci I. Design of analytical method validation protocol evaluating environmental monitoring of AND contamination on surfaces based on cleaning validation procedures: a multi-component RP-UHPLC method. J Chromatogr Sci. 2022;60:926–936. Available from: https://doi.org/10.1093/chromsci/bmac071
- European Medicines Agency (EMA). Guideline on setting health-based exposure limits for use in risk identification in the manufacture of different medicinal products in shared facilities. 2014. Available from: https://www.ema.europa.eu/en/documents/scientific-guideline/guideline-setting-health-based-exposure-limits-use-risk-identification-manufacture-different-medicinal-products-shared-facilities_en.pdf
- European Commission. EU guidelines for good manufacturing practice for medicinal products for human and veterinary use, Annex 15: qualification and validation. 2015. Available from: https://www.gmp-compliance.org/files/guidemgr/2015-10_annex15.pdf
- Active Pharmaceutical Ingredients Committee (APIC). Guidance on aspects of cleaning validation in active pharmaceutical ingredient plants. 2021. Available from: https://apic.cefic.org/wp-content/uploads/2021/09/APIC_Cleaning-validation-guide_2021.pdf