Figure 4
Automatic heartbeat monitoring system
Franchini Roberto*
Published: 30 September, 2019 | Volume 3 - Issue 1 | Pages: 029-034
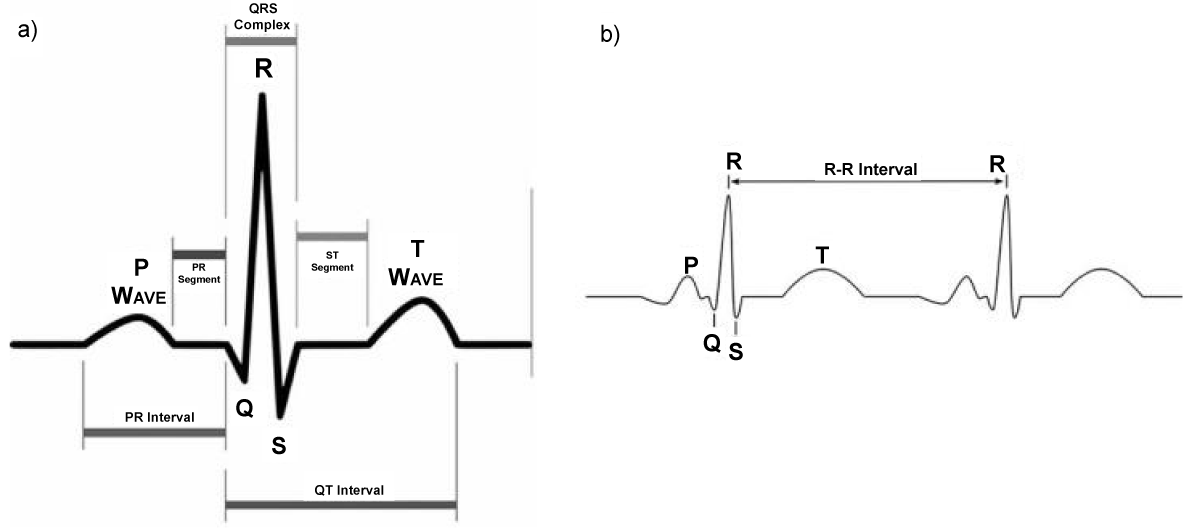
Figure 4:
a) ECG signal from a heartbeat. b ) The RR interval is the time between QRS complexes. The instantaneous heart rate can be calculated from the time between any two QRS complexes.
Read Full Article HTML DOI: 10.29328/journal.acr.1001018 Cite this Article Read Full Article PDF
More Images
Similar Articles
-
Automatic heartbeat monitoring systemFranchini Roberto*. Automatic heartbeat monitoring system. . 2019 doi: 10.29328/journal.acr.1001018; 3: 029-034
Recently Viewed
-
Case Series of Metastatic Cutaneous Malignant Melanoma to the Gallbladder and the First Reported Case of Metachronous Adenocarcinoma of the ColonNourdin Kadi, Abid Chowdhury, Matthew Hanks, Abed M Zaitoun*. Case Series of Metastatic Cutaneous Malignant Melanoma to the Gallbladder and the First Reported Case of Metachronous Adenocarcinoma of the Colon. Ann Clin Gastroenterol Hepatol. 2024: doi: 10.29328/journal.acgh.1001044; 8: 001-005
-
Chronic Ethanol Decreases the Left Ventricular Cardiac PerformanceCamargo VMB*, Damatto FC, Fioravante VC, Godoi AR, Stoppa EG, Okoshi MP, Okoshi K, Miranda JRA, Martinez FE. Chronic Ethanol Decreases the Left Ventricular Cardiac Performance. J Cardiol Cardiovasc Med. 2024: doi: 10.29328/journal.jccm.1001181; 9: 067-072
-
Avermectins: The promising solution to control plant parasitic nematodesMohamed S Khalil*,Dalia M Darwesh. Avermectins: The promising solution to control plant parasitic nematodes. J Plant Sci Phytopathol. 2019: doi: 10.29328/journal.jpsp.1001036; 3: 081-085
-
COVID-19 Associated acute limb ischemiaYogendra Mishra*,Satish Kumar,Meghna K. COVID-19 Associated acute limb ischemia. J Clin Med Exp Images. 2021: doi: 10.29328/journal.jcmei.1001021; 5: 005-005
-
The identification of the true nature of pseudofungus structures as polyurethane catheter fragmentsCharles M Lombard*. The identification of the true nature of pseudofungus structures as polyurethane catheter fragments. Arch Pathol Clin Res. 2022: doi: 10.29328/journal.apcr.1001029; 6: 005-008
Most Viewed
-
Evaluation of Biostimulants Based on Recovered Protein Hydrolysates from Animal By-products as Plant Growth EnhancersH Pérez-Aguilar*, M Lacruz-Asaro, F Arán-Ais. Evaluation of Biostimulants Based on Recovered Protein Hydrolysates from Animal By-products as Plant Growth Enhancers. J Plant Sci Phytopathol. 2023 doi: 10.29328/journal.jpsp.1001104; 7: 042-047
-
Feasibility study of magnetic sensing for detecting single-neuron action potentialsDenis Tonini,Kai Wu,Renata Saha,Jian-Ping Wang*. Feasibility study of magnetic sensing for detecting single-neuron action potentials. Ann Biomed Sci Eng. 2022 doi: 10.29328/journal.abse.1001018; 6: 019-029
-
Physical activity can change the physiological and psychological circumstances during COVID-19 pandemic: A narrative reviewKhashayar Maroufi*. Physical activity can change the physiological and psychological circumstances during COVID-19 pandemic: A narrative review. J Sports Med Ther. 2021 doi: 10.29328/journal.jsmt.1001051; 6: 001-007
-
Pediatric Dysgerminoma: Unveiling a Rare Ovarian TumorFaten Limaiem*, Khalil Saffar, Ahmed Halouani. Pediatric Dysgerminoma: Unveiling a Rare Ovarian Tumor. Arch Case Rep. 2024 doi: 10.29328/journal.acr.1001087; 8: 010-013
-
Prospective Coronavirus Liver Effects: Available KnowledgeAvishek Mandal*. Prospective Coronavirus Liver Effects: Available Knowledge. Ann Clin Gastroenterol Hepatol. 2023 doi: 10.29328/journal.acgh.1001039; 7: 001-010

HSPI: We're glad you're here. Please click "create a new Query" if you are a new visitor to our website and need further information from us.
If you are already a member of our network and need to keep track of any developments regarding a question you have already submitted, click "take me to my Query."


