
More Information
Submitted: January 10, 2024 | Approved: January 30, 2024 | Published: January 31, 2024
How to cite this article: Iborra-Clar MI, Carlos S, Martón I. Statistical Study of Membrane Performance for Different Pharmaceutical Compounds Removal. Arch Case Rep. 2024; 8: 014-026.
DOI: 10.29328/journal.acr.1001088
Copyright License: © 2024 Iborra-Clar MI, et al. This is an open access article distributed under the Creative Commons Attribution License, which permits unrestricted use, distribution, and reproduction in any medium, provided the original work is properly cited.
Keywords: Membrane performance; Pharmaceutical compound; Ultrafiltration membrane; ANOVA; Rejection index; Permeate flux

Statistical Study of Membrane Performance for Different Pharmaceutical Compounds Removal
Iborra-Clar MI1,2*, Carlos S1,3 and Martón I3
1Department of Chemical and Nuclear Engineering, Polytechnic University of
Valencia, C/Camino de Vera s/n, Valencia, 46022, Spain
2Research Institute for Industrial, Radiophysical and Environmental Safety
(ISIRYM), Polytechnic University of Valencia, Valencia, Spain
3Department of Statistics and Operational Research, MEDASEGI Research Group,
Polytechnic University of Valencia, Valencia, Spain
*Address for Correspondence: Iborra-Clar MI, Department of Chemical and Nuclear Engineering, Research Institute for Industrial, Radiophysical and Environmental Safety (ISIRYM), Polytechnic University of Valencia, C/Camino de Vera s/n, Valencia, 46022, Spain, Email: [email protected]
One of the most important emerging pollutants is pharmaceutical active compounds, which may be responsible, for example, for ecotoxicological changes and microbiological resistance. Wastewater treatment plants are not adequately equipped to remove all of the emerging pollutants contained in the wastewater. The ultrafiltration process has been proven to be effective in traditional wastewater treatment, so it is important to assess the performance of such a technique in the partial elimination of pharmaceutical compounds to avoid contamination. In this work, an assessment of ultrafiltration process operating conditions for eliminating six pharmaceutical compounds: Ibuprofen, Acetaminophen, Naproxen, Diclofenac, Caffeine, and trimethoprim, present in different types of water is performed.
Experimental design is a systematic and structured approach to conducting experiments, and its application can significantly improve the study of membrane technology, reducing the number of assays necessary to obtain meaningful results. The statistical principles application ensures that the results obtained are reliable and representative of the true effects of the variables being studied. Its application helps to obtain valid conclusions from the data and provides a solid basis for making decisions or recommendations regarding the tests and variables to take into account. Membrane processes can involve complex interactions between several factors. Experimental design helps to identify and understand these interactions, allowing researchers to discern the combined effects of different variables. This is crucial to accurately predict and optimize membrane performance.
In this work, ANOVA analysis has been carried out in order to determine the influence of membrane cut-off, solution pH, and feed concentration, as well as their interactions, in permeate flux and the rejection index. The results obtained show similar behavior for Ibuprofen, Naproxen, Diclofenac, and Trimethoprim, being the pH the most important factor. However, no significant factors were found for the acetaminophen and the Caffeine.
In recent years, industrial development has led to the creation of a wide variety of new chemical compounds applied in daily human life. These substances represent a wide range of organic and inorganic compounds, which are considered a cause of interest and concern in society due to their occurrence in surface, ground, and wastewater [1,2].
These new chemical compounds are often referred to as Emerging Contaminants (ECs) and include a number of compound families, such as Personal Care Products (PCPs), Pharmaceutically Active Compounds (PhACs), flame retardants, nanoparticles or Endocrine Disrupting Chemicals (EDCs), among others.
These compounds have been continuously present in our daily lives for decades, but recent improvements in analytical equipment and techniques have allowed them to be detected, and an increasing number of emerging pollutants are identified in surface and groundwaters. Multiple studies have demonstrated their ubiquity in rivers and lakes, although their toxicological effects are not yet fully known in many cases [3]. Despite all this, these compounds have not been fully subject to an adequate evaluation regarding the environmental risks and impacts that they can cause/ on ecosystems and living beings, including their effects on human health. These substances may be responsible, for example, for ecotoxicological changes and microbiological resistance.
This whole issue has gained importance in recent years. The Directive 2000/60/EC, was the first brand in European water policy, actually with a list of 33 priority substances, and their respective Environmental Quality Standards (EQS), that has been increasing in successive years. However, since some priority substances are currently not included in routine monitoring programmes at the EU level, this policy may pose a significant ecotoxicological risk. On the other hand, the Global Water Research Coalition (GWRC) developed a List of international priorities of pharmaceutical products relevant to the water cycle, based on the compounds that present a potential risk to the water supply (Global Water Research Coalition, 2022). According to the GWRC, there are 44 compounds and they are classified into three main groups: Class I (10), Class II (18), and Class III (16), classified according to the following criteria: human toxicity, ecotoxicity, degradability, resistance to treatment and environmental incidence [4,5].
Furthermore, the increased use of these compounds together with the increase in population and the average life expectancy, have led to a higher generation of global waste derived from industrial and residential activities. Wastewater Treatment Plants (WWTPs) are designed for the removal of biodegradable organic matter and nutrients. However, these conventional systems are not adequately equipped to remove all of the emerging pollutants contained in the wastewater, detecting concentrations of these compounds at trace levels in the plant outlet (ng·L−1 range) [6,7].
It is important to acknowledge that the insufficient elimination of these substances leads to discharge into the aqueous effluent, which results in the contamination of aquatic environments; or in the absorption in the sewage sludge resulting from the treatment. Additionally, groundwater contamination from leaching or land runoffs could indirectly prompt a risk to human health through the food chain due to contamination of drinking water [8,9].
In summary, the incorporation of these compounds into the environment is extremely worrying due to their bioremediation, as well as their magnitude and bioaccumulative effects. A large number of authors have investigated a variety of technologies for the removal of ECs as a complement to the WWTP treatment [10-12]. Although coagulation and biological processes are applied primarily to remove turbidity, Natural Organic Matter (NOM), and soluble organic pollutants from water, their removal efficiency of ECs is rather low. Therefore, other complementary techniques are required to improve conventional treatment, such as advanced oxidation processes [13,14], microbial fuel cells [15], proton-exchange membrane (PEM) cells [16], adsorption [17-19] or membrane separation processes [20-22]. However, the behavior, destination, and mechanism of the ECs removal by some new combined technological processes in waterworks are still not well understood.
Pressure-driven membrane processes are a good alternative to complete biological processes as a tertiary treatment [23]. The processes of Ultrafiltration (UF), Nanofiltration (NF), or Reverse Osmosis (RO) were evaluated as efficient effluent-improving advancements in municipal wastewater treatment plants for the removal of selected contaminants therefore improving water quality according to water reuse requirements. Fouling phenomena can be considered as a very important factor to be studied in detail. Although the membrane separation process is widely applied, fouling of the membrane surface certainly reduces its permeability, restricting its application [24].
Various studies employing membrane processes have been carried out to investigate the removal mechanisms and efficiencies of Pharmaceutically Active Compounds (PhACs). In addition to fouling phenomena and their damaging effects, the performance, hydrophobicity, and surface charge of the membranes have been widely reported by different researchers [25,26].
Hydrophobicity and surface charge are two physicochemical properties that are important influences on permeation systems as well as the interactions of hydrophobic attraction and electrostatic repulsion [27].
As the surface charge changes, dispersion, dipolar induction, H-bonding, or metallic interactions can orient the adhesion of chemical species on the membrane surface, controlling the separation and hence its performance.
In this aspect, molecular chemistry can be addressed to manipulate specific interactions, improving the compatibility between polymer surface and chemical species to be separated [28].
The potential effects of hydrophobicity and surface charge on membrane fouling have influenced several aspects of these parameters [29], the foulant hydrophobicity [30], the effect of foulant in surface charge [31] and the combined effect of all of them [32,33].
The aim of this work is to study the statistical behavior of different operating factors that influence the ultrafiltration process, such as the cut-off of the membrane, the pH, and the feed concentration, as well as the interactions on all of these in the permselectivity and index rejection of membranes.
In order to do this, different experiments have been carried out with a representation of six pharmaceutical compounds, both individually and collectively. In addition, the influence of the set of ECs in the presence of NOM has also been studied.
All assays have been treated according to an Experimental Design (DOE) considering as factors the feed pH, membrane cut-off, and PhAC concentration. Being the response variables the permeate flux and the rejection index of the different compounds.
A novel aspect of this work is the study of the statistical influence of the feed solution pH (ranging from 6 to 10), the molecular weight cut-off (MWCO) of the selected membranes (1 - 8 kDa), and the concentration of the PhACs selected (between 300 - 1000 ng/L) on the membrane performance, and the interaction of these with each other.
Experiments were carried out in a self-made ultrafiltration plant, with a cross-flow membrane permeation unit of Tamy industries®. Six PhACs were selected with diverse physicochemical characteristics (Table 1), added in deionised water individually (Feed I), added in deionised water collectively (Feed II), and collectively in a WWTP secondary effluent (Feed III).
| Table 1: Physicochemical properties of the selected PhACs studied. (Garcia-Ivars, J. et Al., 2017a). | |||||||||
| Ref | Pharmaceutical active compound | CAS No. |
Formula | Molecular weight (g mol-1) |
Log Kowa | pKaa | Charge (pH=7) |
Hydrophobic Hydrophilicb |
Molar Volume (cm3 mol-1)c |
| 1 | Ibuprofen | 15678-27-1 | C13H18O2 | 206.286 | 3.679 | 4.40 | -1 | Hydrophobic | 200.5 |
| 2 | Acetominofen | 103-90-2 | C8H9NO2 | 151.166 | 0.494 | 9.86 | 0 | Hydrophilic | 121.0 |
| 3 | Naproxen | 2204-53-1 | C14H14O3 | 230.265 | 2.816 | 4.15 | -1 | Hydrophobic | 192.4 |
| 4 | Diclofenac | 15307-79-6 | C14H10Cl2NNaO2 | 318.136 | 4.640 | 4.08 | -1 | Hydrophobic | 207.0 |
| 5 | Caffeine | 58-08-2 | C8H10N4O2 | 194.194 | -0.040 | 10.40 | 0 | Hydrophilic | 133.9 |
| 6 | Trimethoprim | 738-70-5 | C14H18N4O3 | 290.36 | 0.981 | 6.6-7.1 | +1 | Hydrophilic | 231.9 |
| aSciFinder Scholar, data calculated at 20°C and 760 torr using
Advanced Chemistry Development (ACD/Labs) Software V11.02 (©1994–2016 ACD/Labs). bHydrophobic when log KOW > 2. cChem3D Ultra 8.0. |
|||||||||
Water permeability and rejection index are treated by DOE in order to statistically study the interactions between both variables.
The selected PhACs (ibuprofen, acetaminophen, naproxen, diclofenac, caffeine, and trimethoprim) were selected with diverse physicochemical characteristics.
All of them were purchased from Sigma-Aldrich (Germany) with a purity grade (⩾ 99%). These PhACs were selected due to their occurrence and persistence in effluents from WWTPs and surface water in the Spanish Mediterranean area of Valencia [34]. Table 1 shows their main physicochemical properties.
These organic compounds have similar molecular weights and distinguishing features including water solubility, molar volume, log KOW, and pKa which make them interesting to be compared. The six selected PhACs represented the most common PhACs found in WWTP secondary effluents in the Spanish Mediterranean area of Valencia, found acetaminophen and ibuprofen in concentrations ranging from 1000 ppb to several μg/L and the rest of the target compounds in lower concentration ranges from 200 – 400 ppb [34].
The pH of feed solutions was adjusted between 4 - 10 pH units, using 0.1 M HCl / 0.1 N NaOH solutions, and was controlled using a Crison pH meter before starting permeation experiments. Both, HCl and NaOH solutions were obtained of reagent grade from Panreac (Spain).
Deionised water was used throughout this study to prepare the assays of Feed I and Feed II. The secondary effluent samples of the waste-water treatment plant (Feed III) were supplied/given by El Carraixet WWTP, located in the region of Valencia (Spain). The characterisation of these samples was performed according to Standard Methods for the Examination of Water and Wastewater [35].
Their physicochemical characteristics are summarised in Table 2.
| Table 2: Characteristics of the secondary effluents from a WWTP [35]. | |
| Parameter | Feed solutiona |
| pH | 7.98 ± 0.13 |
| m-Alkalinity (mgCaCO3 ·L-1) | 340.12 ± 13.55 |
| Conductivity (µS·cm-1) | 1574.50 ± 53.92 |
| TSS (ppm) | 157.00 ± 53.92 |
| Turbidity (NTU) | 19.43 ± 1.96 |
| CDO (mg O2 ·L-1) | 86.02 ± 12.59 |
| UV 254 | 0.504 ± 0.002 |
| Total Nitrogen (mgN2 ·L-1) | 73.30 ± 16.10 |
| Proteins (mg· L-1) | 62.2 5± 10.03 |
| aAverage ± standard desviation. | |
All the feed solutions were prepared with the selected PhACs, at different concentrations for each of them, between 1 and 1000 ng/L individually (Feed I) and between 300 - 1000 ng /L according to the range detected to WWTP output (Feed II and III). The concentration selected in mixtures has been 1000 ppb from acetaminophen and ibuprofen and 300 ppb from the rest of the compounds.
Concentrations of PhACs in permeate, retentate, and feed samples were determined by the High-Performance Liquid Chromatography tandem-mass spectrometry (HPLC-MS/MS) method.
An Agilent Technologies 1260 Infinity Ultra High-performance LiquidChromatograph coupled to an Agilent Technologies 6410 TripleQuadrupole Mass Spectrometer with an electrospray Turbo V ionisation source and a C18 column (Kinetex, 1.7 lm, 100 Å,50 x 2.10 mm) from Phenomenex (France) were used.
The different PhACs concentrations were previously described and determined in both positive and negative ionisation modes, depending on the PhAC measured. Quantified and qualified transitions were optimised for each PhACs by Selected Reaction Monitoring (SRM), which were previously described in other contributions [36,37].
Pilot plant experimental procedure
The permeation experiments were carried out in a self-made cross-flow ultrafiltration plant whose scheme is represented in Figure 1, employed in other experiences of the PROMETEO research group [36]. This cross-flow system was supplied with a temperature and pH-controlled feed tank, with a 25 L capacity, a pre-filter system, a variable speed volumetric pump, a flow meter, and two manometers (from 0 to 6 bar) placed at the inlet and outlet streams of the membrane cell to adjust the transmembrane pressure assay. The parameter conditions in the pilot plant were fixed in 2 bar for transmembrane pressure, 20 ºC feed temperature, and 300 L·h-1 of feed flow.
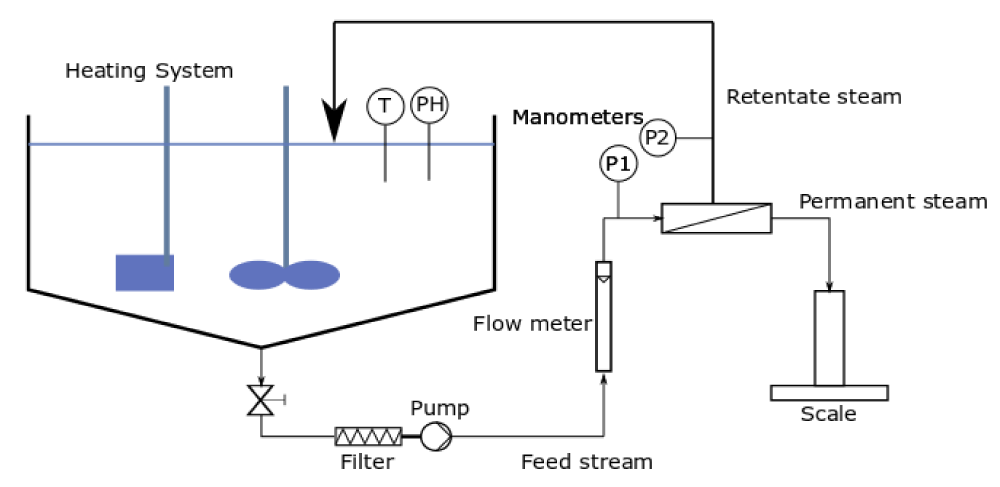
Figure 1: Schematic diagram of the standard cross-flow ultrafiltration setup [36].
Finally, a gravimetric balance was used with an accuracy of ± 0.001 g to measure the permeate flux.
The UF membrane cell and the employed membranes were supplied by TAMI Industries, (France). Multicanal UF ceramic membranes referenced as INSIDE CéRAM™ with a nominal pore size of 1, 5, and 8 kDa were employed.
These membranes consisted of an active layer of TiO2 with an effective area of 132 cm2 and their dimensions were 25 cm long with an external diameter of 1 cm.
Firstly, the hydraulic permeability or water permeability coefficient, K (L·m-2·h-1·bar-1) was calculated for each membrane, using deionised water. These experiments were performed in the aforementioned standard cross-flow ultrafiltration plant set up at different transmembrane pressures (ΔP) ranging from 0.5 to 3 bar, at a constant flow rate of 300 L h−1.
The hydraulic permeability is shown in Table 3.
| Table 3: Hydraulic permeability coefficient of UF membranes. | |
| Cut-off membrane kDa | Hydraulic permeability coefficienta L·m−2·h−1·bar−1 |
| 1 | 38.2 ± 2.2 |
| 5 | 40.4 ± 2.6 |
| 8 | 60.7 ± 3.6 |
| aAverage ± standard deviation. | |
Planification of experiences
The experiences carried out for the application of the Design of Experiments (DOE), in which the Feed solution pH, PhAC concentration, and the weight cut-off membrane have been considered to analyze their influence on membrane rejection and membrane flux.
For each PhAC (Table 1) dissolved in deionised water (Feed I) three levels of pH, concentration, and membrane cut-off, have been considered, as exposed in Table 4, so a total of 27 experiments for each PhAC have been performed.
In addition, a mixture of the PhAC has been analysed with two different types of feed, Feed II (deionized water) and Feed III (WWTP secondary effluent). In both cases, the feed pH and cut-off membrane have been considered to analyse the rejection of each PhAC. Moreover, the same parameters have been used to observe their influence on the membrane flux for Feed II and Feed III. Table 4 summarizes the experiments carried out in this work.
| Table 4: Summary of the experiments. | ||||
| Type Feed | pH | PhAC Concentration (ppb) |
Cut-off membrane (kDa) |
Nº of experiments |
| Feed I | 4, 7, 10 | 1, 500, 1000 | 1, 5, 8 | 27 |
| Feed II | 6, 7, 8 | Mixture(*) | 1, 5, 8 | 9 |
| Feed III | 6, 7, 8 | Mixture(*) | 1, 5, 8 | 9 |
| (*)1000 ppb each PhAC. | ||||
Statistical analysis
Firstly, to carry out multifactor ANOVA the assumptions of normality, independence, and homoscedasticity of the data were tested in advance. In this analysis, the hypothesis of normality for every variable was tested using the Shapiro–Wilk test and the coefficients of skewness and kurtosis. Homoscedasticity assumptions were evaluated by the Levene test and scatterplots. For each performed ANOVA in this work, normality, and homoscedasticity assumptions have been considered [38]. Then, ANOVA was performed at a 95% confidence level and Fisher’s Least Significant Difference (LSD) was used to compare pH, PhAC Concentration, and Cut-off membrane in the response variable (flux or rejection membrane) of each type of water (Feed I, Feed II and Feed III). The calculations have been performed using the statistical software Statgraphics Centurion 18 [38]. In the following sections, the results of the ANOVA obtained are discussed.
Feed I: Individual PhAC with deionised water: As said above, a total of 27 experiments for each pharmaceutically active compound have been performed. In order to analyse the significance of concentration, membrane cut-off, and pH in the rejection and membrane flux, an ANOVA analysis has been performed for each substance, considering a significant level of 5%.
Table 5 shows a summary of ANOVA results for membrane rejection for each PhAC. This table shows the factors (pH, PhAC Concentration, and Cut-off membrane) and their second-level interactions in which differences in the rejection percentage at the 5% level of significance have been observed which means that the p - value should be less than or equal to 0.05 to observe a statistical significance at a 95% confidence level. Therefore, the p - values of each factor are desired to be close to zero.
| Table 5: Summary ANOVA results for membrane rejection (%). | ||
| PhAC | Significant parameter | p - value |
| Ibuprofen | pH | 0.0030 |
| PhAC Concentration*Cut-off membrane | 0.0111 | |
| Acetominofen | No 5% significance | > 0.05 |
| Caffeine | No 5% significance | > 0.05 |
| Naproxen | pH | 0.000 |
| Diclofenac | pH | 0.000 |
| Trimethoprim | pH | 0.0310 |
From the results obtained in the ANOVA, it is observed that the pH is the factor in which differences between the behaviour of membrane rejection for Ibuprofen, Naproxen Diclofenac, and Trimethoprim are observed. Fisher’s Least Significant Difference (LSD) is calculated for each PhAC observing that for the Ibuprofen, Naproxen, and Diclofenac the best rejection values are obtained for high pH values (pH = 10).
The three compounds are hydrophobic and with similar pKa, close to 4, as observed in Table 1, which can explain the same behaviour in the membrane rejection. As an example, Figure 2 shows the rejection means depending on pH values for Ibuprofen, for Naproxen and Diclofenac the same behaviour is observed.
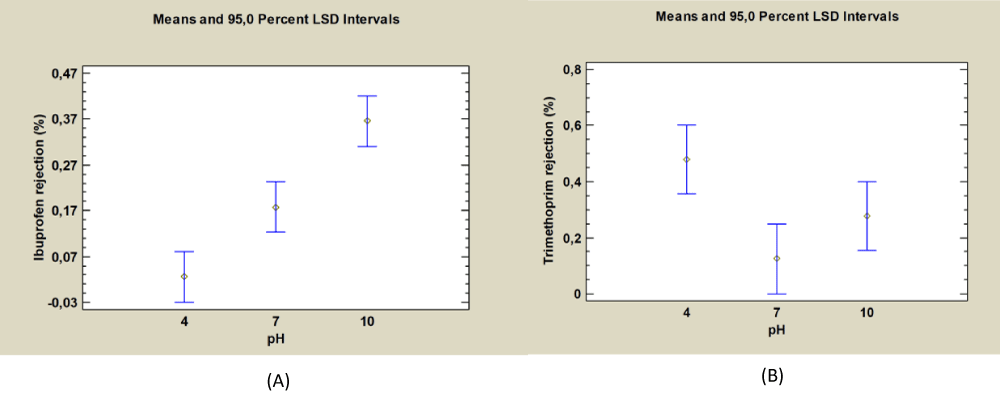
Figure 2: Rejection means vs. pH for Ibuprofen (A) and Trimethoprim (B).
The UF process is generally based on the size exclusion mechanism, although in this case it could be considered insufficient because the molecular weight of the PhACs is much lower than the MWCO of the tested membranes. For this reason, it cannot be considered a simple filtration process, because the interactions between solute-solute and solute-membrane surfaces (hydrophobic and electrostatic interactions) play an important role in the retention of the different PhACs [37].
As explained in previous publications of the group [36,37], the rejection of the compound PhACs depends on the value of its pKa and the pH of the feeding solution. In this term, and since the isoelectric point of the selected ceramic membranes is 6.2 ± 0.1, the rejection rates of the PhACs can vary with respect to their physicochemical properties, such as structure, molecular weight, and dissociation constant (pKa). A change in the pH of the feed solution can significantly vary the behavior of a PhAC. A PhAC is negatively charged at pH values higher than its pKa value, and conversely, this PhAC will be neutral or positively charged, or even a mixture of both, at pH values lower than pKa.
Given only that molecular exclusion could not explain this rejection rate, the electrical charge property of each PhAC is an important factor that can affect the performance of the separation process.
The conclusion obtained from the results shown in the ANOVA (Table 5) indicates that the change in pH is only significant for the rejection rate of hydrophilic compounds whose pKa is below or close to the pH of the experiment, not being significant in Acetaminophen and Caffeine, both hydrophilic compounds but with a high pKa value of 9.86 and 10.40 respectively.
However, Trimethoprim variation with pH, which is also significant in the ANOVA, reveals a different behaviour. Thus, the best rejection is obtained at low pH values, as Trimethoprim is also a hydrophobic compound, but with a pKa = 7.12 below or close to the pH experiment, it can be concluded that is this latter characteristic the cause of the pharmaceutical compound behaviour.
Regarding membrane flux, Table 6 shows a summary of ANOVA results for each PhAC. This table shows the factors (pH, PhAC Concentration, and Cut-off membrane) and their second-level interactions in which differences in the flux membrane at the 5% level of significance.
| Table 6: ANOVA results summary for membrane flux. | ||
| PhAC | Significant parameter | p - value |
| Ibuprofen | PhAC Concentration | 0.0000 |
| Cut-off membrane | 0.0000 | |
| pH | 0.0003 | |
| PhAC Concentration*Cut-off membrane | 0.0002 | |
| PhAC Concentration*pH | 0.0005 | |
| Acetaminophen | Cut-off membrane | 0.0000 |
| pH | 0.0001 | |
| PhAC Concentration*Cut-off membrane | 0.0001 | |
| Naproxen | PhAC Concentration | 0.0000 |
| Cut-off membrane | 0.0000 | |
| pH | 0.0000 | |
| PhAC Concentration*Cut-off membrane | 0.0000 | |
| Diclofenac | PhAC Concentration | 0.0000 |
| Cut-off membrane | 0.0044 | |
| pH | 0.0001 | |
| PhAC Concentration*Cut-off membrane | 0.0041 | |
| Cut-off membrane*pH | 0.0056 | |
| Caffeine | PhAC Concentration | 0.0007 |
| Cut-off membrane | 0.0000 | |
| pH | 0.0029 | |
| Trimethoprim | Cut-off membrane | 0.0000 |
| pH | 0.0026 | |
| Cut-off membrane*pH | 0.0499 | |
Also, Fisher’s Least Significant Difference (LSD) is calculated for each PhAC to select the parameters that provide high flux values. All PhAC have the same behaviour with respect to pH, PhAC Concentration, and Cut-off membrane. As an example, Figure 3 shows the flux means respect each factor considered in the ANOVA, for Ibuprofen. Figure 3a represents the flux with respect to pH values showing that the highest flux value is obtained for pH = 4. Regarding the PhAC concentration, Figure 3b shows that the highest flux values are obtained for concentrations 500 ppb and 1000 ppb, and no differences are observed between these values. Finally, Figure 3c represents the flux means for different membrane cut-offs, showing that there is no difference between 1 kDa and 5 kDa (probably due to some experimental error or membrane fouling), and observing that the highest flux is obtained for 8kDa.
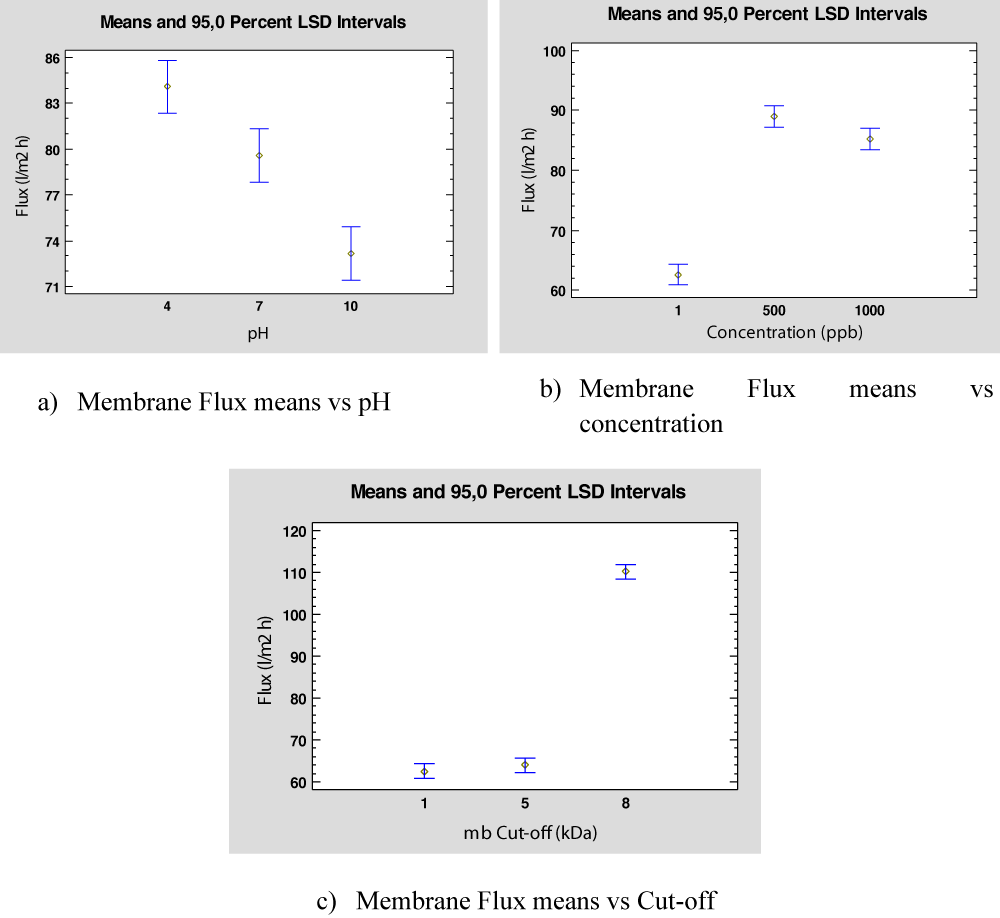
Figure 3: Flux means with respect to each factor for Ibuprofen.
Once again, the influence of pH becomes important for the UF process. In the case of Ibuprofeno, a hydrophobic compound with a pKa of 4.4, as we have seen previously, it shows its best behavior at pH = 4, with respect to the membrane flux. On the other hand, due to the low concentration of PhAC in the feed (of the order of ppb), the variation of the concentration shows low relevance in the permeate flow of the experiments. Finally, the effect of membrane flux depends on the cut-off, as might be expected, the higher the membrane cut-off obtains the greater the flux. It should not be forgotten that the fundamental mechanism of UF is molecular exclusion. When the membrane cut-off increases with respect to the Molecular Weight (MWO) of the compounds, the interactions are less significant.
Feed II: Mixture of PhAC with deionised water: The same procedure has been undertaken to analyze the difference between the entrance flux and pHAC rejection for different levels of the cut-off membrane and pH when a mixture of all the PhAC is considered in the study using deionized water. Thus, the values for membrane cut-off and pH, and each PhAC rejection are exposed in Table 7. Using these data, an ANOVA has been performed to analyse the effect of membrane cut-off, pH, and PhAC on the mixture rejection, obtaining the results exposed in Table 8.
| Table 7: Membrane cut-off, pH, and rejection (%) for each PhAC Feed Type II. | |||||||
| Membrane cut-off |
pH | 1 | 2 | 3 | 4 | 5 | 6 |
| Ibuprofen | Acetominofen | Naproxen | Diclofenac | Caffeine | Trimetoprin | ||
| 1 | 6 | 37.372 | 43.462 | 44.724 | 39.326 | 17.366 | 45.534 |
| 1 | 7 | 60.709 | 43.882 | 55.085 | 65.211 | 16.847 | 41.049 |
| 1 | 8 | 62.405 | 49.765 | 61.280 | 62.879 | 20.388 | 31.158 |
| 5 | 6 | 27.053 | 25.914 | 31.925 | 28.907 | 15.638 | 36.235 |
| 5 | 7 | 34.960 | 29.594 | 33.017 | 33.187 | 14.295 | 34.047 |
| 5 | 8 | 29.232 | 32.000 | 35.372 | 37.618 | 8.352 | 28.474 |
| 8 | 6 | 13.689 | 20.549 | 12.559 | 22.980 | 6.196 | 18.334 |
| 8 | 7 | 19.574 | 22.659 | 43.514 | 26.135 | 10.430 | 14.386 |
| 8 | 8 | 22,570 | 22.774 | 20.118 | 31.384 | 8.587 | 12.425 |
| Table 8: Summary ANOVA results of PhAC mixture Feed II for the membrane rejection. | |
| PhAC Mix. | p - value |
| Principal effects | |
| A: pH | 0.0083 |
| B: membrane cut-off | 0.0000 |
| C: PhAC | 0.0000 |
| Interactions | |
| AB | 0.3315 |
| AC | 0.0562 |
| BC | 0.0362 |
The ANOVA results show that all the factors are significant, considering a significance level of 5%, the mean value of the percentage of rejection is different for pH, membrane cut-off, and PhAC type, as observed in Figures 4a-c, respectively. Figure 4a shows that there is no difference between working at pH = 7 or pH = 8, and it is also observed that high pH values provide a greater rejection percentage. Regarding membrane cut-off, it is observed in Figure 4b that the highest values of rejection percentage are obtained for 1kDa. Finally, Figure 4c shows that the rejection percentage is lower for caffeine (PhAC 5) and trimethoprim (PhAC 6) with respect to the others. In fact, the lowest rejection value observed is for Caffeine, which should be studied in more detail.
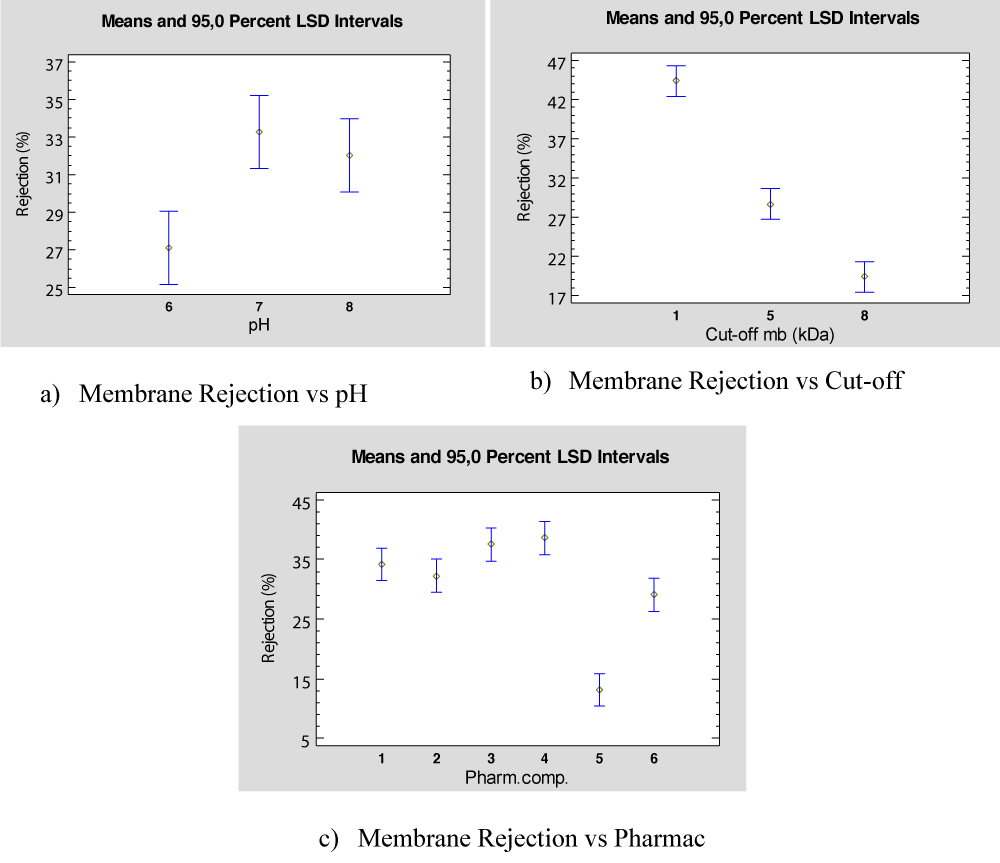
Figure 4: Effect of each parameter on membrane rejection for Feed II.
The most relevant interaction found is membrane cut-off and PhAC, with a p - value of 0.0362 exposed in Table 9. Figure 5a shows that, in general, the highest rejection percentage is obtained using a 1kDa membrane, for all the PhAC in the mixture. For Ibuprofen, Acetominofen, Naproxen, and Diclofenac (PhACs 1, 2, 3, and 4) working with 1kDa membrane is clearly the best option, for Caffeine and Trimethoprim (PhACs 5 and 6, respectively) this effect is not so evident as the tolerance intervals are embedded what implies that the membrane cut-off is not significant.
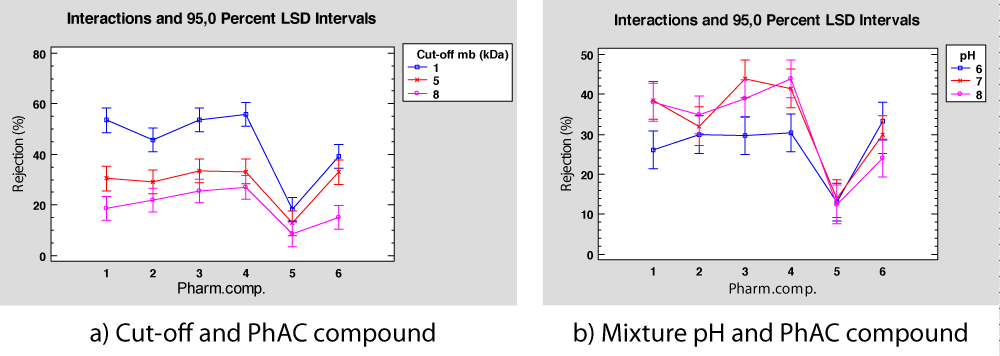
Figure 5: Interactions in rejection percentage for deionized water mixture.
Caffeine (PhAC 5) presents an extremely low rejection compared with other PhACs, like acetaminophen, which also has a lower MWO and Molar Volume. In Figure 4a, Caffeine and acetaminophen show a low rejection index, as we can see previously in Figure 4c, justified in part by their lower MWO and Molar Volume, so a more detailed study of Caffeine behaviour should be performed.
Regarding the interactions between mixture pH and rejection for each PhAC, the ANOVA provides a p - value of 0.0562 (Table 7), thus this interaction is not considered significant in the analysis, as the standard threshold for significance is set at 5%. However, the graphical representation, see Figure 5b, shows that some interaction between both factors is observed. For example, a slight interaction is observed for Ibuprofen, Naproxen, and Diclofenac (PhAC 1,3, and 4) which can be explained as they present a similar pKa, close to 4.
Membrane flux can be analyzed to observe the differences between membrane cut-off and the mixture pH for Feed II. In this case, Table 9 gathers the data obtained in these experiments for different pH and membrane cut-off and Table 10 shows the results of the ANOVA. Both factors are statistically significant at a 5% significant level. As shown in Figure 6a and Figure 6b, flux is significative high when pH is equal to 6 and membrane cut-off is equal to 8 KDa.
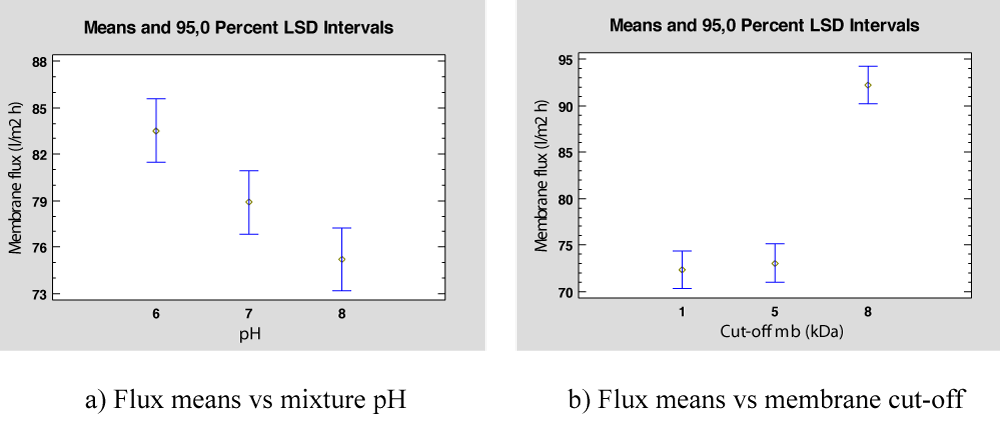
Figure 6: Flux means for PhAC mixture in deionized water.
| Table 9: Membrane flux measurement for deionized water. | |||
| pH | |||
| Cut-off kDa | 6 | 7 | 8 |
| 8 | 98. 6641 | 91.1531 | 86.8778 |
| 5 | 76.7536 | 73.6164 | 68.7536 |
| 1 | 75.1618 | 71.8745 | 69.9785 |
| Table 10: Summary ANOVA results of PhAC mixture Feed II for the membrane flux. | |
| PhAC Mix. | p - Value |
| Principal effects | |
| A: Membrane cut-off | 0.0003 |
| B: Mixture pH | 0.0124 |
Feed III: Mixture of PhAC with water from WWTP secondary effluent: Finally, an experiment with a mixture of the PhACs in WWT water has been performed. The values measured for each PhAC rejection depending on the membrane cut-off and mixture pH are exposed in Table 11.
| Table 11: Rejection percentage measured for each PhAC (%) from WWTP effluent. | |||||||
| Cut-off kDa |
pH | 1 | 2 | 3 | 4 | 5 | 6 |
| Ibuprofen | Acetominofen | Naproxen | Diclofenac | Caffeine | Trimetoprin | ||
| 1 | 6 | 44.328 | 31.350 | 24.626 | 36.905 | 2.904 | 44.622 |
| 1 | 7 | 50.148 | 33.916 | 27.276 | 43.825 | 6.731 | 23.989 |
| 1 | 8 | 54.537 | 34.343 | 31.438 | 59.437 | 6.974 | 44.731 |
| 5 | 6 | 31.089 | 14.441 | 17.140 | 20.186 | 14.278 | 19.311 |
| 5 | 7 | 35.601 | 22.310 | 19.716 | 24.905 | 12.475 | 6.996 |
| 5 | 8 | 37.426 | 30.471 | 20.103 | 36.039 | 11.659 | 17.903 |
| 8 | 6 | 19.346 | 7.233 | 7.305 | 10.657 | 8.934 | 19.977 |
| 8 | 7 | 20.426 | 19.492 | 9.533 | 20.207 | 5.305 | 3.748 |
| 8 | 8 | 22.088 | 16.936 | 11.626 | 23.859 | 3.465 | 31.500 |
As we can see in Table 11, most of the rejection index percentages decrease in relation to the results of Table 7 when the compounds are not in the presence of NOM. These increases (between 15% - 30% depending on the PhA compound) could be justified by the existence of PhAC adsorption processes in the organic matter matrix, which cause the PhAc concentration in feed water (Type III) to decrease compared to PhAc concentration in feed Type II.
Using these data an ANOVA has been performed, which results are found in Table 12.
| Table 12: Summary ANOVA results of PhAC mixture Feed III for the membrane rejection. | |
| PhAC mixture Feed III | |
| Principal effects | p - Value |
| A: Cut-off mb | 0.0000 |
| B: Mixture pH | 0.0000 |
| C: Pharm. Comp. | 0.0000 |
| Interactions | |
| AB | 0.9502 |
| AC | 0.0000 |
| BC | 0.0001 |
The ANOVA results show that all the parameters con-sidered are significant in the rejection percentage obtained. Figure 7 shows the rejection mean values versus each parameter considered. Thus, Figure 7a represents the rejection means versus the membrane cut-off and shows that the best rejection is found for the 1kDa. Regarding the pH mixture, the best rejection percentage is found for high pH values, as shown in Figure 7b. Finally, Figure 7c presents the mean rejection percentage depending on the PhAC present in the feed, and it is observed that the best rejection value is found for Ibuprofen (PhAC 1) and the worst rejection observed is for Caffeine (PhAC 5).
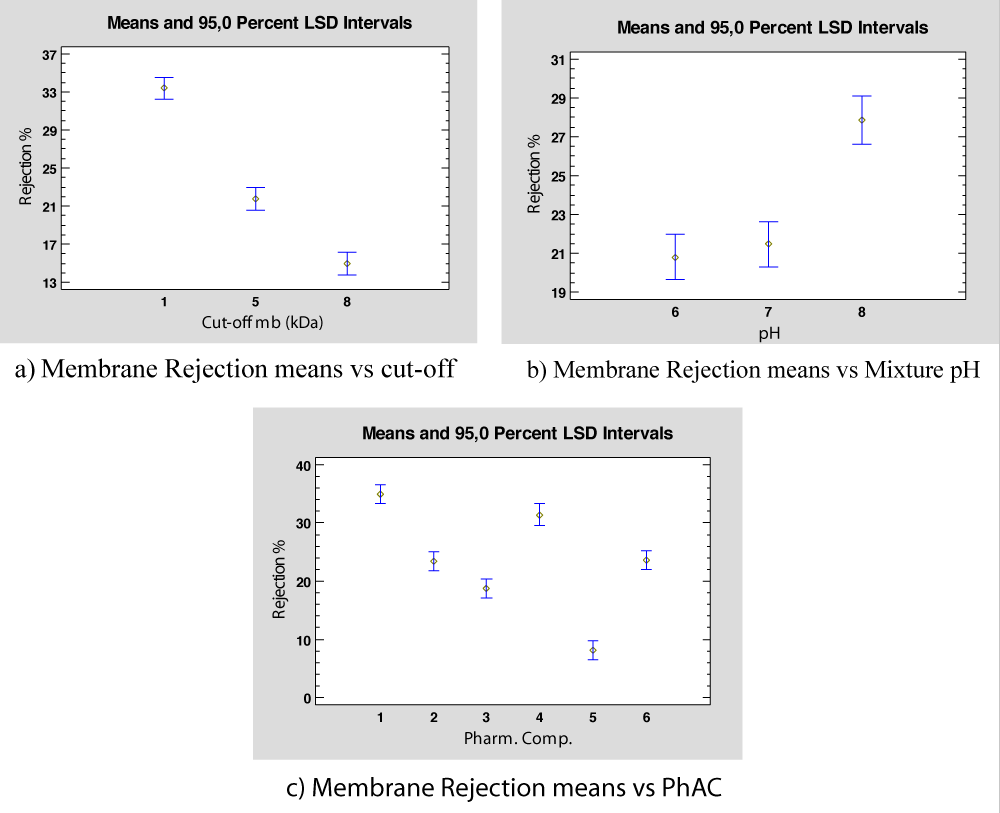
Figure 7: Effect of the three parameters in wastewater.
From ANOVA results, see Table 12, the interaction between Cut-off and PhAC is considered significant in the analysis. As shown in Figure 8a all the substances, except Caffeine (PhAC 5) have similar behaviour with respect to the membrane cut-off, low cut-off values provide high rejection percentages. For Caffeine, there is no observed difference with respect to the membrane used, so a more detailed study should be performed.
Regarding the interactions between the mixture pH and PhAC compound, see Figure 8b, it is observed that Ibuprofen, Acetaminophen, Naproxen, and Diclofenac have the same behaviour (PhAC 1, 2, 3, and 4), the rejection improves as pH value decreases, especially in the case of Diclofenac. This latter PhAC has a pKa value of 4.08 (Table 1) which is the lowest value, thus it seems that as larger is the difference between this value and the mixture pH higher rejection is obtained. For Trimethoprim, although the best rejection is also observed for the lowest pH value, the worst is obtained for pH = 7 which is the medium value of pH used in the experiments, probably this can be due to the compound pKa value that is 7.12, quite similar to the pH mixture. Once more, the Caffeine presents a different behaviour, obtaining low rejection values for all pH values.
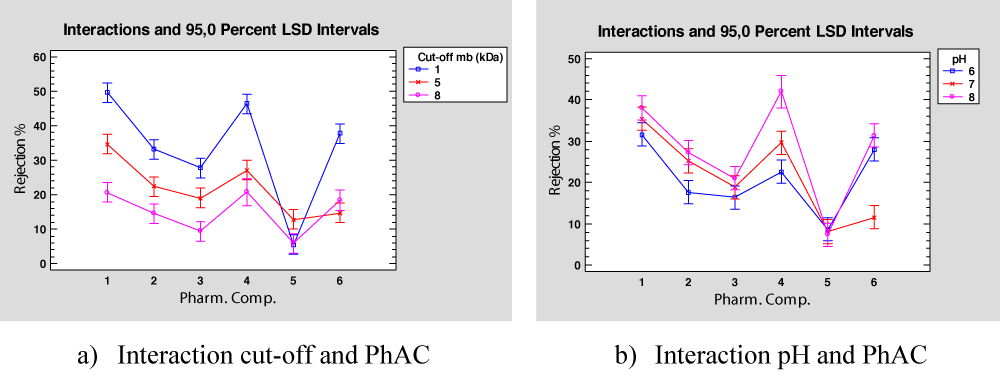
Figure 8: Interaction in wastewater mixture.
The membrane flux has also been measured for each experiment; the values are presented in Table 13.
| Table 13: Membrane flux measurement for WWT water. | |||
| Cut-off kDa |
pH | ||
| 6 | 7 | 8 | |
| 8 | 52.0109 | 41.4943 | 40.1866 |
| 5 | 52.1522 | 31.8012 | 27.1644 |
| 1 | 39.6183 | 35.4933 | 36.1993 |
An ANOVA has also been undertaken considering as parameters the membrane cut-off and the mixture pH. The results of the analysis are exposed in Table 13, and show that none of the parameters resulted significantly, however for mixture pH the p - value is quite close to the threshold normally proposed of 5% (Table 13). Graphically, Figure 9a shows the mean flux versus in mixture pH, for pH = 7 and pH = 8, and no difference is observed, in the case of pH = 6 the flux is higher and could be considered different. For membrane cut-off, no difference is observed in the membrane flux as presented in Figure 9b (Table 14).
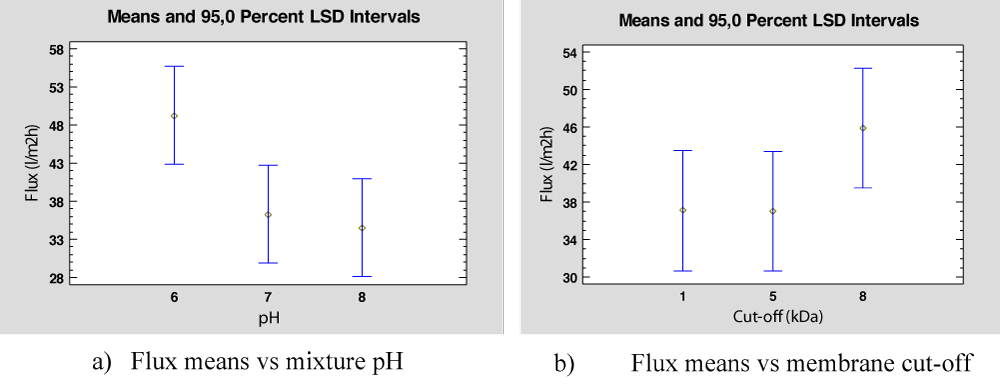
Figure 9: Flux means for PhAC mixture in WWT water.
| Table 14: Summary ANOVA results of PhAC mixture Feed III for the membrane flux. | |
| Principal effects | p - Value |
| A: Cut-off | 0.2034 |
| B: Mixture pH | 0.0612 |
The study proposed in this work has been carried out to obtain the best conditions to increase membrane rejection by performing an ANOVA study to analyse and determine the factors (pH, membrane cut-off, and concentration) that have influenced increasing the performance of the membranes.
An ANOVA for each individual PhAC, considering factors feed pH, membrane cut-off and concentration has been performed to study the effect of these parameters on rejection and membrane flux. The results showed that Ibuprofen, Naproxen, and Diclofenac present similar behaviour, observing the pH as the most significant factor. Thus, the best rejection is found for high pH values, but the largest flux is obtained for low feed pH values. However, for Trimethoprim the largest rejection values are obtained and low feed pH. Finally, in this analysis Acetaminophen and Caffeine do not present any significant factor regarding the rejection percentage, more experiments be performed to perform a more detailed study.
Regarding the mixture of PhAC with deionized water (Feed II) the ANOVA factors considered were pH, membrane cut-off, and PhAC to analyse their influence on rejection percentage and membrane flux. From the study developed on rejection percentage, it is observed that, in general, high values of pH and low values for membrane cut-off provide higher rejection values. There is a significant interaction that shows that Caffeine provides the lowest rejection values, regardless of the membrane cut-off. So, this PhAC should be studied in more detail. For membrane flux in Feed II, pH and cut-off resulted in significant and higher values of flux are found for low pH values and high membrane cut-off.
Finally, for the PhAC mixture in WWT, Feed III, all the factors considered in the study resulted statistically significant rejection percentage. Thus, in general, rejection is improved at high pH values, and low membrane cut-off values, and depending on the PhAC it has been observed that the best rejection percentage is obtained for Ibuprofen and, again, Caffeine shows a rejection value extremely low. Nevertheless, most of the rejection index percentages decrease when the compounds are not in NOM presence (between 15-30% depending on the PhA compound) and could be justified by the existence of PhAC adsorption processes in the organic matter matrix and the initial concentration is low in these essays.
In fact, the interactions between the factors considered in the study show that using low membrane cut-off all rejection for all PhACs is clearly improved, except for Caffeine. Regarding the interaction between pH and PhAC, a slight improvement in rejection percentage is observed with high pH values, especially for Diclofenac (PhAC 4) although, as the intervals are in most cases embedded this effect is, statistically, less significant than the other one. In any case, Caffeine should be analysed in more detail. Regarding the membrane flux, none of the parameters resulted significantly which means that the value obtained in the experiment will not be influenced by the values of pH and membrane cut-off used in the experiments.
In this way, it could be concluded that for the separation of most PhACs tested, pH will be the most important factor. Avoid trials with the study of other variables that are less significant according to the DOE tested.
Thanks to the MINISTERIO DE ECONOMÍA Y COMPETITIVIDAD for granting the proyect “Evaluacion de la viabilidad tecnica y economica para la eliminacion de compuestos farmacologicos persistentes presentes en aguas residuales”. Ref. CTM2013-42342-P
Highlights
- Pharmaceutical active compounds are present in waste water and present a potential risk to the water supply.
- Membrane performance can be affected by different parameters such as membrane cut-off, pH, and concentration.
- ANOVA analysis can be used to detect the influencing parameters and their interactions.
- Riva F, Zuccato E, Davoli E, Fattore E, Castiglioni S. Risk assessment of a mixture of emerging contaminants in surface water in a highly urbanized area in Italy. J Hazard Mater. 2019 Jan 5; 361:103-110. doi: 10.1016/j.jhazmat.2018.07.099. Epub 2018 Aug 2. PMID: 30176408.
- Kesari EtAl. Kesari KK, Soni R, Jamal QMS. Wastewater Treatment and Reuse: a Review of its Applications and Health Implications. Water Air Soil Pollut. 2021; 232: 208. https://doi.org/10.1007/s11270-021-05154-8
- Meffe R, de Bustamante I. Emerging organic contaminants in surface water and groundwater: a first overview of the situation in Italy. Sci Total Environ. 2014 May 15; 481:280-95. doi: 10.1016/j.scitotenv.2014.02.053. Epub 2014 Mar 4. PMID: 24602913.
- Rizzo L, Malato S, Antakyali D, Beretsou VG, Đolić MB, Gernjak W, Heath E, Ivancev-Tumbas I, Karaolia P, Lado Ribeiro AR, Mascolo G, McArdell CS, Schaar H, Silva AMT, Fatta-Kassinos D. Consolidated vs new advanced treatment methods for the removal of contaminants of emerging concern from urban wastewater. Sci Total Environ. 2019 Mar 10; 655:986-1008. doi: 10.1016/j.scitotenv.2018.11.265. Epub 2018 Nov 20. PMID: 30577146.
- Marcantonio Di, Marcantonio Di. Fate and Removal of Emerging Contaminants in Water and Wastewater Treatment Plants. Rome, Italy. 2020.
- Martín-Pozo L, de Alarcón-Gómez B, Rodríguez-Gómez R, García-Córcoles MT, Çipa M, Zafra-Gómez A. Analytical methods for the determination of emerging contaminants in sewage sludge samples. A review. Talanta. 2019 Jan 15; 192:508-533. doi: 10.1016/j.talanta.2018.09.056. Epub 2018 Sep 19. PMID: 30348425.
- Nanusha MY, Frøkjær EE, Liigand J, Christensen MR, Hansen HR, Hansen M. Unravelling the occurrence of trace contaminants in surface waters using semi-quantitative suspected non-target screening analyses. Environ Pollut. 2022 Dec 15; 315:120346. doi: 10.1016/j.envpol.2022.120346. Epub 2022 Oct 3. PMID: 36202272.
- Li P, Karunanidhi D, Subramani T, Srinivasamoorthy K. Sources and Consequences of Groundwater Contamination. Arch Environ Contam Toxicol. 2021 Jan;80(1):1-10. doi: 10.1007/s00244-020-00805-z. Epub 2021 Jan 2. PMID: 33386943; PMCID: PMC7778406.
- Alfaia etAl, Alfaia R, Almeida R, Soares S, Carbonelli J. Landfill leachate pretreatment effects on nanofiltration and reverse osmosis membrane performance. Process Safety and Environmental Protection. 2023; 172. https://doi.org/10.1016/j.psep.2023.02.038
- Huang Z, Gong B, Huang CP, Pan SY, Wu P, Dang Z, Chiang PC. Performance evaluation of integrated adsorption-nanofiltration system for emerging compounds removal: Exemplified by caffeine, diclofenac and octylphenol. J Environ Manage. 2019 Feb 1; 231:121-128. doi: 10.1016/j.jenvman.2018.09.092. Epub 2018 Oct 16. PMID: 30340131.
- Tran NH, Reinhard M, Gin KY. Occurrence and fate of emerging contaminants in municipal wastewater treatment plants from different geographical regions-a review. Water Res. 2018 Apr 15;133:182-207. doi: 10.1016/j.watres.2017.12.029. Epub 2017 Dec 28. PMID: 29407700.
- Lopez FJ, Pitarch E, Botero-Coy AM, Fabregat-Safont D, Ibáñez M, Marin JM, Peruga A, Ontañón N, Martínez-Morcillo S, Olalla A, Valcárcel Y, Varó I, Hernández F. Removal efficiency for emerging contaminants in a WWTP from Madrid (Spain) after secondary and tertiary treatment and environmental impact on the Manzanares River. Sci Total Environ. 2022 Mar 15; 812:152567. doi: 10.1016/j.scitotenv.2021.152567. Epub 2021 Dec 22. PMID: 34952067.
- Huang Z, Wu P, Lu Y, Wang X, Zhu N, Dang Z. Enhancement of photocatalytic degradation of dimethyl phthalate with nano-TiO2 immobilized onto hydrophobic layered double hydroxides: a mechanism study. J Hazard Mater. 2013 Feb 15;246-247:70-8. doi: 10.1016/j.jhazmat.2012.12.016. Epub 2012 Dec 17. PMID: 23287410.
- Alvarez-Corena JR, Bergendahl JA, Hart FL. Advanced oxidation of five contaminants in water by UV/TiO2: Reaction kinetics and byproducts identification. J Environ Manage. 2016 Oct 1; 181:544-551. doi: 10.1016/j.jenvman.2016.07.015. Epub 2016 Aug 5. PMID: 27423767.
- Zhou Y, Zhu N, Guo W, Wang Y, Huang X, Wu P, Dang Z, Zhang X, Xian J. Simultaneous electricity production and antibiotics removal by microbial fuel cells. J Environ Manage. 2018 Jul 1; 217:565-572. doi: 10.1016/j.jenvman.2018.04.013. Epub 2018 Apr 7. PMID: 29635189.
- Ashrafi ETAl, Ashrafi H, Pourmahmoud N, Mirzaee I, Ahmadi N. Performance improvement of proton-exchange membrane cells through different gas injection channel geometries. Energy Research. 2022; 46: 7. https://doi.org/10.1002/er.7755
- Lujan-Facundo ETAl, Lujan-Facundo MJ, Iborra-Clar MI. Pharmaceutical compounds removal by adsorption with commercial and reused carbon coming from a drinking water treatment plant. J. of Clean. Prod. 2019; 238. https://doi.org/10.1016/j.jclepro.2019.117866
- Yang, Hu, Yang YX, Hu XJ. Decontamination of tetracycline by thiourea-dioxide-reduced magnetic graphene oxide: effects of pH, ionic strength, and humic acid concentration. J. Colloid Interf. Sci. 2018; 495. https://doi.org/10.1016/j.jcis.2017.01.075
- Ahmed MJ. Adsorption of non-steroidal anti-inflammatory drugs from aqueous solution using activated carbons: Review. J Environ Manage. 2017 Apr 1; 190:274-282. doi: 10.1016/j.jenvman.2016.12.073. Epub 2017 Jan 4. PMID: 28063293.
- Garcia-Ivars J, Martella L, Massella M, Carbonell-Alcaina C, Alcaina-Miranda MI, Iborra-Clar MI. Nanofiltration as tertiary treatment method for removing trace pharmaceutically active compounds in wastewater from wastewater treatment plants. Water Res. 2017 Nov 15; 125:360-373. doi: 10.1016/j.watres.2017.08.070. Epub 2017 Sep 1. PMID: 28881212.
- Wang J, Wang S. Removal of pharmaceuticals and personal care products (PPCPs) from wastewater: A review. J Environ Manage. 2016 Nov 1; 182:620-640. doi: 10.1016/j.jenvman.2016.07.049. Epub 2016 Aug 20. PMID: 27552641.
- Vona A, Martino DIF. Comparison of different removal techniques for selected pharmaceuticals. J. Water Process. Eng. 2015; 5. http://dx.doi.org/10.1016/j.jwpe.2014.12.0112214-7144/
- SUEZ UF. Membranes to be used in process upgrade at major WWTP in IsraelMembrane Technology. 2019; 6. https://doi.org/10.1016/S0958-2118(19)30101-6
- Abuwatfa WH, AlSawaftah N, Darwish N, Pitt WG, Husseini GA. A Review on Membrane Fouling Prediction Using Artificial Neural Networks (ANNs). Membranes (Basel). 2023 Jul 24;13(7):685. doi: 10.3390/membranes13070685. PMID: 37505052; PMCID: PMC10383311.
- Van DBB, Mänttäri M, Nyström M. Drawbacks of applying nanofiltration and how to avoid them: A review. Sep. and Pur. Tech. 2008; 63: 251-263. https://doi.org/10.1016/j.seppur.2008.05.010
- Kang G, Baek Y, Yoo JB. Relationship between surface hydrophobicity and flux for membrane separation. RSC Advances. 2022. DOI: 10.1039/d0ra07262a
- Xiao K, Wang X. Combined effect of membrane and foulant hydrophobicity and surface charge on adsorptive fouling during microfiltration. J. of Mem. Sc. 2011; 373: 1-2; 140-151. https://doi.org/10.1016/j.memsci.2011.02.041
- Garcia-Ivars J, Iborra-Clar MI, Alcaina-Miranda MI, Van der Bruggen B. Comparison between hydrophilic and hydrophobic metal nanoparticles on the phase separation phenomena during formation of asymmetric polyethersulphone membranes. J. of Mem. Sc. 2015; 493: (1). https://doi.org/10.1016/j.memsci.2015.07.009
- Nitti F. Selan O, Hoque B, Tambaru D. Improving the performance of polymer inclusion membranes in separation process using alternative base polymers: A review. Journal of Chemistry. 2022; 22: 1. https://doi.org/10.22146/ijc.68311
- Yu CH, Wu CH, Lin CH, Hsiao CH, Lin CF. Hydrophobicity and molecular weight of humic substances on ultrafiltration fouling and resistance. Sep. Purif. Technol. 2008; 64: 206-212. https://doi:10.1016/j.seppur.2008.10.008
- Trinh TA, Li W, Chew JW. Internal fouling during microfiltration with foulants of different surface charges. Journal of Membrane Science. 2020; 602. https://doi.org/10.1016/j.memsci.2020.117983
- Leo CP, Cathie Lee WP, Ahmad AL, Mohammad AW. Polysulfone membranes blended with ZnO nanoparticles for reducing fouling by oleic acid. Sep. Purif. Technol. 2012; 89. https://doi.org/10.1016/j.seppur.2012.01.002
- Sotto A, Boromand A, Zhang R, Luis P, Arsuaga JM, Kim J, Van der Bruggen B. Effect of nanoparticle aggregation at low concentrations of TiO2 on the hydrophilicity, morphology, and fouling resistance of PES-TiO2 membranes. J Colloid Interface Sci. 2011 Nov 15;363(2):540-50. doi: 10.1016/j.jcis.2011.07.089. Epub 2011 Aug 11. PMID: 21875711.
- Gracia-Lor E, Sancho JV, Serrano R, Hernández F. Occurrence and removal of pharmaceuticals in wastewater treatment plants at the Spanish Mediterranean area of Valencia. Chemosphere. 2012 Apr;87(5):453-62. doi: 10.1016/j.chemosphere.2011.12.025. Epub 2012 Jan 4. PMID: 22221664.
- Garcia-Ivars J, Martella L, Massella M, Carbonell-Alcaina C, Alcaina-Miranda MI, Iborra-Clar MI. Nanofiltration as tertiary treatment method for removing trace pharmaceutically active compounds in wastewater from wastewater treatment plants. Water Res. 2017 Nov 15; 125:360-373. doi: 10.1016/j.watres.2017.08.070. Epub 2017 Sep 1. PMID: 28881212.
- García-Ivars J, Dura-Maria J, Moscardo-Carreño C, Carbonell Alcaina C, AlcainaMiranda MI, Iborra Clar MI. Rejection of trace pharmaceutically active compounds present in municipal wastewaters using ceramic fine ultrafiltration membranes: Effect of feed solution pH and fouling phenomena. Separation and Purification Technology. 2017; 175. https://doi.org/10.1016/j.seppur.2016.11.027
- Ganiyu ED, Van Hullebusch M, Cretin G, Esposito MA. Oturan, Coupling of membrane filtration and advanced oxidation processes for removal of pharmaceutical residues: a critical review, Sep. Purif. Technol. 2015; 156. https://doi.org/10.1016/j.seppur.2015.09.059
- Statgraphics. Statgraphics Centurion, XVIII. Statpoint Technologies. INC. Version. 2018; 18:1; 13.