
More Information
Submitted: 19 September 2019 | Approved: 27 September 2019 | Published: 30 September 2019
How to cite this article: Roberto F. Automatic heartbeat
monitoring system. Arch Case Rep. 2019; 3: 029-034.
DOI: 10.29328/journal.acr.1001018
Copyright License: © 2019 Roberto F. This is an open access article distributed under the Creative Commons Attribution License, which permits unrestricted use, distribution, and reproduction in any medium, provided the original work is properly cited.
Keywords: Electrocardiography; Electrodes; Android; Arduino; IoT; Heartbeat monitoring; Wavelet; Bluetooth

Automatic heartbeat monitoring system
Franchini Roberto*
National Research Council, Institute of Clinical Physiology, Lecce, Italy
*Address for Correspondence: Franchini Roberto, National Research Council, Institute of Clinical Physiology, Lecce, Italy, Email: [email protected]
The proliferation and popularity of open source hardware and software, such as Arduino and Raspberry PI, together with IoT and Embedded System, has brought the health industry to rapid evolution, creating portable and low-cost medical devices for monitoring vital signals. Electrocardiographic (ECG) equipment plays a vital role for diagnosis of cardiac disease. However, the cost of this equipment is huge and the operation is too much complex which cannot offer better services to a large population in developing countries. In this paper, I have designed and implemented a low cost fully portable ECG monitoring system using android smartphone and Arduino. The results obtained by the device were tested comparing them with those obtained from a traditional ECG used in clinical practice on 70 people, in resting and under-activity conditions. The values of beats per minute (BPM), ECG waveform and ECG parameters were identical, and presented a sensitivity of 97.8% and a specificity of 78.52%.
Cardiovascular diseases (CVDs) are disorders of the heart and blood vessels and include coronary heart disease, cerebrovascular disease, rheumatic heart disease and other conditions. World Health Organization (WHO) research also shows that the most people was dying due to heart illness [1]. Therefore, this disease cannot be taken lightly and need a constant monitoring of cardiac parameters [2]. The Electrocardiography (ECG or EKG) is one of the medical kits that can measure the heartbeat per unit time, convert it into a signal and display the data on a display device [2]. An ECG is a recording of the electrical activity on the body surface generated by the heart muscles, and it is one of the most common heart tests [3]. There are a number of reasons why someone may have an ECG, including an irregular heartbeat, shortness of breath when they exert themselves, significantly high blood pressure, palpitations or a suspected heart valve problem [4]. It is possible to be in cardiac arrest with a normal ECG signal (a condition known as pulseless electrical activity) [5]. Analysing or monitoring the ECG signal at initial stage these disease can be prevented [2]. ECG is an high-priced equipment, low-cost devices are available in the form of wrist watches for the instantaneous measurement of the heart rate. The proliferation and popularity of open source hardware and software, like the Arduino and Raspberry PI, have made it possible to build devices to sense virtually any physical phenomena and display the results either locally on an attached display, or remotely via a Bluetooth or Wi-Fi module to a pc or smartphone [6]. This paper depicts the design of a fully automatic ECG monitoring system Arduino based on battery powered. The system sends the signals detected on the subject by Ag / Cl sticking electrode on the arms and right left, to an android application on smartphone, showing the ECG wave, beats per minutes (BPM), and the principal hearth parameter: P-Wave, PR interval, PR segment, QRS complex, ST segment, QT interval and T wave. If there are anomalies or values out of normal range, the software will highlight the abnormal values and send an emergency call. This study wants to demonstrate how it is possible to realize a portable, intuitive, automatic and low-cost ECG device with the quality of an ECG traditionally used in clinical practice.
The purpose of this study is to create a low-cost, intuitive and automatic device of acquisition and monitoring of the cardiac activity signals. This system can be used directly by the subject who wants to control himself, also not necessarily having a found heart disease. Remote ECG monitoring systems are becoming commonplace medical devices for remote and long term physiological monitoring, especially for that of the elderly and frail patients [6]. The systems are consisted of three major components:
• a mobile gateway, deployed on the patient’s mobile device, that receives 12-lead ECG signals from any ECG sensor
• a remote server component that hosts algorithms for accurate annotation and analysis of the ECG signal
• a point-of-care device for the doctor to receive a diagnostic report from the server based on the analysis of the ECG signals
The wireless physiological information collection nodes of the wearable network are connected to the patient’s portable terminal, such as a personal digital assistant (PDA), smart phone, or other communication device, to send data. At the same time, it is also capable of uploads, backup, analysis, and feedback of data to a remote medical service centre through the internet or mobile communications network [6].
Mehdi Shokoueinejad, et al. [7] proposed a fully operational portable ECG system for training and educational purposes in biomedical engineering (BME) curriculum courses, based on Arduino. The device need for an USB connection with a pc to display the results using a labview software; therefore, it was not really portable, but more suitable for training and educational purposes.
Bhimasen, et al. [8] proposed a prototype ECG generator circuit low cost, battery powered making it portable with wireless connectivity for transferring the signal to the PC and Smart Phone.
Harini, et al. [9] presented a study to use handheld tele-electrocardiogram (ECG) to identify heart condition in the rural underserved population where the doctor-patient ratio is low and access to health care is difficult. The objective of the study was clinical validation of handheld ECG as a screening tool for evaluation of cardiac diseases in the rural population. The proposed system for the ECG monitoring controlled was composed by the Arduino UNO microcontroller and implemented in the form of android app application.
Udit Satija (Student Member, IEEE), et al. [10] proposed a novel signal quality aware IoT-enabled ECG telemetry system for continuous cardiac health monitoring applications. The proposed quality-aware ECG monitoring system consists of three modules:
1. ECG signal sensing module;
2. automated signal quality assessment module;
3. and signal-quality aware ECG analysis and transmission module.
This system is highly demand robust methods for accurate and reliable detection and measurement of morphological RR interval features from noise-free and noisy ECG signals. So, it gives the quality of ECG signal and noise free ECG, accuracy and robustness of QRS complex detection [10].
Chowdhury, et al. [11] proposed the development of a wearable system for real-time detection and warning of heart attacks in drivers, which could be enormously helpful in reducing road accidents. The system consists of two subsystems that communicate wirelessly using Bluetooth technology. The sensor subsystem records the electrical activity of the heart from the chest area to produce electrocardiogram trace and send that to the other portable decision-making subsystem where the symptoms of heart attack are detected. The system can help in reducing the loss of lives from the growing number of road accidents all over the world.
All these systems had some design issues and, in particular, cost factor played a very crucial role.
The proposed system in this paper, is portable, it does not need to be connected to a pc or other device, and can be used in any environment with a cost factor being minimum very affordable to all the lower and middle class family in every countries
Figure 1 represents the block diagram of the proposed system. Three electrodes are placed on the Left Arm (LA), Right Arm (RA) and Right Leg (RL) of the patient’s body. Electrodes of ECG Sensor have 3 pins and connected by cable with 30 inches in length [12]. In additional, the plug-in for the cable is a male sound plug which will make the cable to easily removed or inserted into the amplifier board. The sensor assembled on an arm pulse and a leg pulse. The input is taken from the human body and then it is transmitted to ECG module (AD8232).
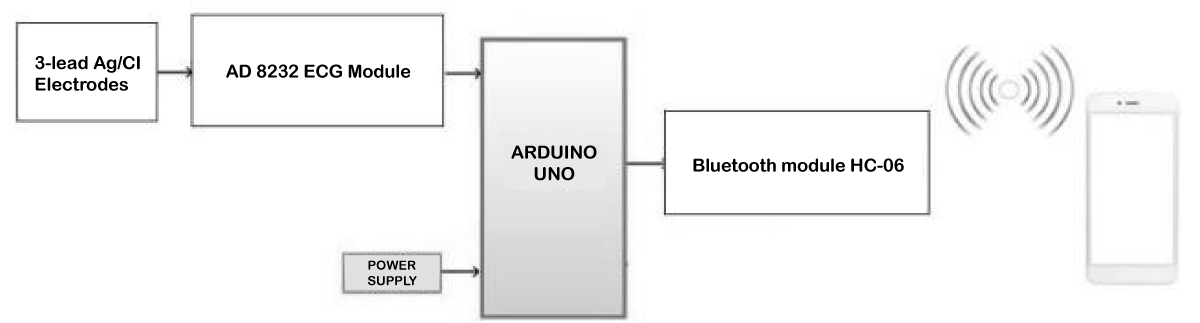
Figure 1: Pictorial representation of the system.
ECG module (AD8232)
The AD8232 is an low-cost, high accuracy instrumentation amplifier, integrated signal conditioning block for ECG and other bio-metric measurement applications. It measures the electrical activity of a beating heart through electrodes taped to the skin; it produces the continuous analog values according to the input given by the electrodes, the final measurement results can be displayed as an electrocardiogram. It is designed to pull out, amplify, and filter less energy bio-potential signals in the presence of noisy conditions, such as those created by movement or remote electrodeposition. Additionally, there is a LED indicator light that will pulsate to the rhythm of a heartbeat. This design allows for an ultralow power analog-to-digital converter (ADC) or an embedded microcontroller to obtain the output signal. The AD8232 can execute a two-pole high-pass filter for eliminating motion artificial facts and the electrode half-cell potential. This filter is tightly coupled with the instrumentation amplifier design to allow both large gain and high-pass filtering in a first stage, thereby saving money and space. 3-lead Ag/Cl Electrodes transform bio-medical signals into electrical voltage The voltage lies in between 1 mV ~ 5 mV. The pair of sensors are placed on the LA, RA and RL of the patient (Figure 2) [12-14].
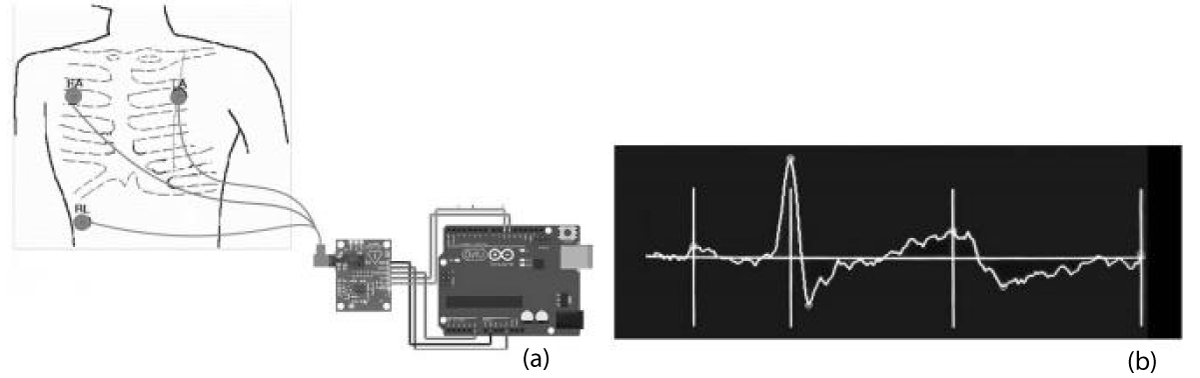
Figure 2: a) Placement of the electrodes and interfacing of AD8232 and Arduino Uno. B) ECG signal.
Arduino uno
The Arduino Uno is an 8-bit microcontroller board based on the ATmega328 [10]. It has 14 digital input/output pins, 6 analog inputs, a 16 MHz crystal oscillator, a power jack, an ICSP header a USB connection and a reset button. Arduino UNO returns a linear value from 0 to 1023 corresponding to 0V and +5V respectively. For serial transmission baud rate is taken as 9600 bps and sampling rate of 320 samples per second is used. Arduino Uno has a built in USART communication feature which allow USART transmission and reception via digital pins 1 and 0 [15]. For serial communication pin 1 and pin 0 of Arduino UNO needs to connect with Bluetooth modules Rx and Tx. A Bluetooth module HC-06 does signal transmission between Arduino UNO and Android phone. Arduino Uno can also communicate with laptop via USB cable.
Power supply
The device uses two 9V disposable Lithium battery for making it portable. For safety and short circuit protection, a voltage regulator LM7805 is used.
Arduino software
The software implemented on the Microcontroller Arduino UNO, is written in assembly C language. Figure 3 depicts a flow chart to ECG measurement. The flow starts from getting inputs from the ECG module (AD8232). The microcontroller checks whether all three inputs are given properly. If someone of the inputs is not detected well, the system send a warning; if all inputs are detected, the software send the signal thought the Bluetooth module HC-06 at the Android application to process cardiac parameters.
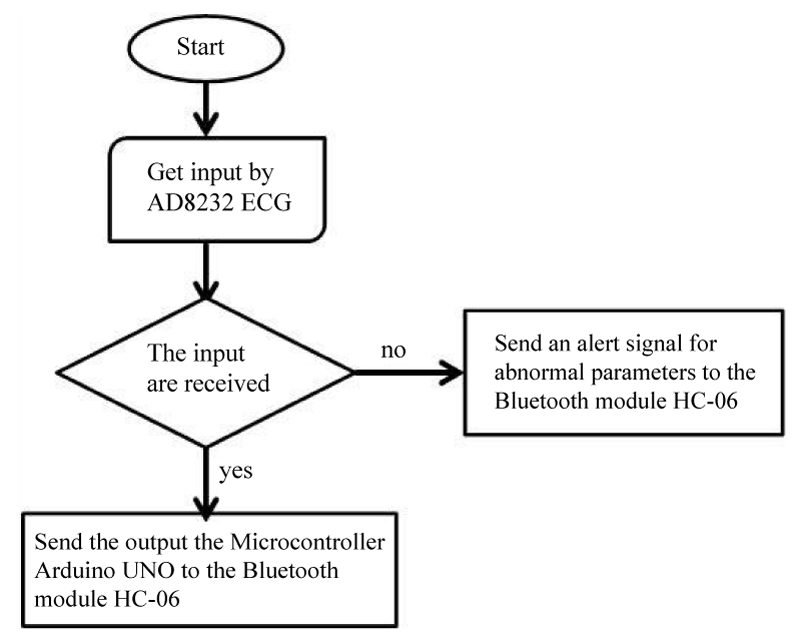
Figure 3: Flow chart Arduino software.
App android
The Android application receives the digitized signals, handles the processing and extrapolation of ECG data for varying degrees of measurement and interpretation and displays all of the data to the user via a custom Graphical Unit Interface (GUI).
Before the further signal processing, it needs to denoised the recorded raw. The noise in the ECG signal may come from instability environment record, false signals from nearby equipment, weak electrodes and electromagnetic noise, other physiological signals. These noises could be modelled as white noise [16], which could be denoised based on Wavelet Transform (WT). The WT of the ECG signal f(x) is defined in (1):
𝑊𝑠𝑓(𝑥) = f(x)∗Ѱ𝑠 = (1/𝑠)∫ 𝑓(𝑡)Ѱ ((𝑥−𝑡)/𝑠 ) 𝑑𝑡 (1)
Where Ѱ is the Daubechies wavelet due to similarity of the shape to the QRS wave of ECG signal (Figure 4a).
During the noise removal, we should be careful to retain the main features of the signal.
Several researches have survived the noise removal methods from the ECG signal. An important aim, in this study, is to apply a method with the last amount of change in the real signal and low computational load for having a minimum of delay at execution time. In this research, the baseline noise is removed firstly. For this purpose, I estimate the trend of the signal with curve-fitting methods and then it decreases from the ECG signals. In the next stage, an IIR low-pass filter is used to remove high frequency noise from the signal and it has 55 Hz cutoff frequency and third-order,chebyshev type. Finally, a two-stage moving average is performed to smooth out fluctuations.
One cycle ECG (Figure 4a), consist of P wave QRS wave until T wave. P wave offers benefit information about the propagation time of the impulse to both atria [4]. Then, follow with a flat trend called with the PR segment which is in consequence of propagation of the electric impulse from atria to ventricles. And follow with QRS complex wave [17]. The QRS complex give information about the ventricular systole in consequence of the impulse propagation to the ventricles (Q wave), whereas the transmission to the whole tissue is caused by the R and S waves. The QRS complex provides information about fibrillation and arrhythmias [13]. Then ST interval represents the period during which ventricles are contracting, which is the last stage of the heart cycle [2]. The T wave permits to have information about the cardiac hypertrophy, heart attacks, and ischemia [17]. Moreover, others parameters, such as the QT interval, allow specific further pathologies to be characterized. Finally, the ECG signal ended with a small peak. Part of this QRS complex is the “R” apex point (Figure 4b) which corresponds to the depolarization of the right and left ventricles of the heart. The Android application implements a real-time QRS detection algorithm based on the Pan-Tompkins Algorithm [18]
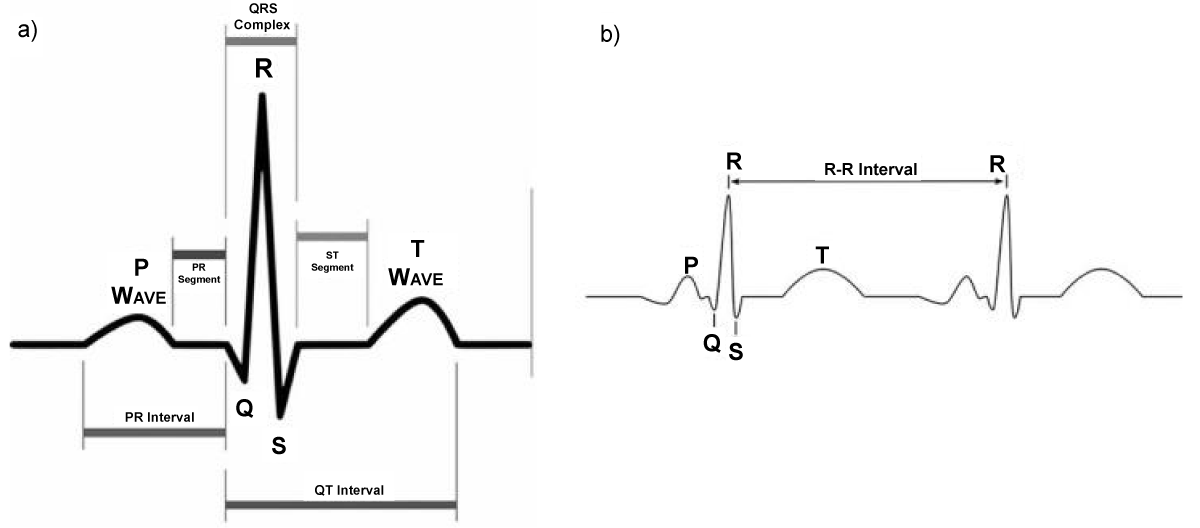
Figure 4: a) ECG signal from a heartbeat. b ) The RR interval is the time between QRS complexes. The instantaneous heart rate can be calculated from the time between any two QRS complexes.
The overall detection system is mainly composed of three processing stages:
• a moving average-based high-pass filtering (HPF),
• a non-linear low-pass filtering (LPF), and
• a decision making stage.
An ECG signal is processed by the linear HPF to accentuate the QRS complex, and meanwhile, to suppress the undesired waves of ECG, such as P or T waves. Then, low-amplitude artefacts can be smoothed down to a certain level while the QRS feature can be well preserved; the linear HPF output is then processed by a full-wave rectification and LPF followed by a sliding-window summation; thus resulting in an envelope-like feature waveform. Finally, an adaptive threshold (1) is applied to perform the decision-making for completing a QRS complex detection.
treshold = α*γ * win_max + (1 - γ) * treshold; (1)
where:
0≤α≤1.
The values of γ can be between 0.15 and 0.2. I fixed it empirically: γ = 0.175.
The win max is the local maximum newly detected in the feature waveform.
To determine the R wave positions, the algorithm searched for the maximum positive point and minimum negative point pair using the high frequency scale [17,19]. The distance (in milliseconds) between each “R” is defined as the “RR interval” (Figure 4b). A search window was implemented to determine the P wave and T wave at low frequencies. Further, when registering a heartbeat, we get a simple series of numbers (intervals between every two consecutive heart beats in milliseconds, in average 70 numbers during 1 minute, for example, 721, 743, 824, 801, 789, etc.) these numbers are each characterized by strongly different physiological or psychological conditions. From the ECG parameters, analysis a Heart Rate Variability (HRV) of the ECG signal is implemented like Root Mean Square of the Successive Differences (RMSSD) (2):
(2)
Finally, QRS complex, the BPM, RR interval, PR interval and RT interval are displayed on the GUI and compared to the normal hearth parameters (Table 1), in this way the system may predict which disease the user potentially suffering from. If one of the values is out of range, it is immediately highlighted; at the same time the application makes an emergency call and sending an alert message with the parameters out of range.
| Table 1: Normal ECG parameters. | ||
| Event/Interval/Segment | Normal range | Amplitude |
| P Wave | 0.06-0.11 sec | <0.25 PR |
| PR Interval | 0.12-0.20 sec | - |
| PR Segment | 0.08 sec | - |
| QRS Complex | <0.12 sec | 0.8-1.2 |
| ST Segment | 0.12 sec | - |
| QT Interval | 0.36-0.44 sec | - |
| T Wave | 0.16 sec | <0.5 |
| R-R interval | 0.6-1 sec | |
The system gets the input bio-metric signals from the human body using 3-lead electrodes. It checks whether all the three inputs are received properly and sends the signal to Bluetooth module transmitting to an application Android phone. The App Android processes the received data and shows BPM; RR, PR, and RT intervals and the ECG waveform [3] on the GUI comparing them to the normal parameters (Table 1). The performance tests were based on the comparison between the results in term of:
• R wave peaks
• RR interval
• PR and QT intervals in 60 seconds
• beats per minute
• QRS complex
• PR and ST segment
• P wave
Coming from Arduino ECG automatic approach, and those obtained from a certified medical devices (gold standard): OMRON HEART-SCAN HCG-801-E. The results were carried out by a trained cardiologist on a total of 70 healthy subjects (45 Male - 25 Female) with ages 20/70 years old gave their written informed consent to participate in the study. First, it was counted the number of R wave peaks, RR, PR and QT intervals in 60 seconds. All the results were able to identify the 100% of R peaks correctly, and overall, the PR and QR intervals had the same length; the estimated beats per minute (BPM) for each of them had no significant difference (Table 2).
| Table 2: Average resting hearth rate in beats for minutes (BPM) for men and women Pulse rate varies by age and sex. | ||
| Men | ||
| Age | Gold standard system | Proposed automatic system |
| 20-25 | 61.52 | 62.00 |
| 26-35 | 61.87 | 62.00 |
| 36-45 | 62.05 | 62.11 |
| 46-55 | 63.00 | 63.00 |
| 56-65 | 61.75 | 62.05 |
| >65 | 61.00 | 61.08 |
| Women | ||
| Age | Gold standard system | Proposed automatic system |
| 20-25 | 65.25 | 65.00 |
| 26-35 | 64.25 | 64.10 |
| 36-45 | 64.50 | 64.00 |
| 46-55 | 65.30 | 65.20 |
| 56-65 | 64.48 | 64.35 |
| >65 | 64.50 | 64.50 |
The measurements of average RR intervals between gold standard and automatic device had a correlation coefficient resulted r = 0.993, as graphically reported in figure 5. Then the algorithm was tested using 37 one-minute long ECG data sets from the MIT-BIH Arrhythmia Database. The detected beats were compared to the annotated information with each ECG signal. The algorithm implemented in this project was able to achieve a sensitivity of 97.8% and a specificity of 78.52%, the percentage of correctly classified heartbeats varied from 87% to 100% with an average of 97.92%, the average error rate for the detected RR interval was 0.07%, the RMSSD error rate was 0.69%. Finally, the RR50 error rate was 0.72%.
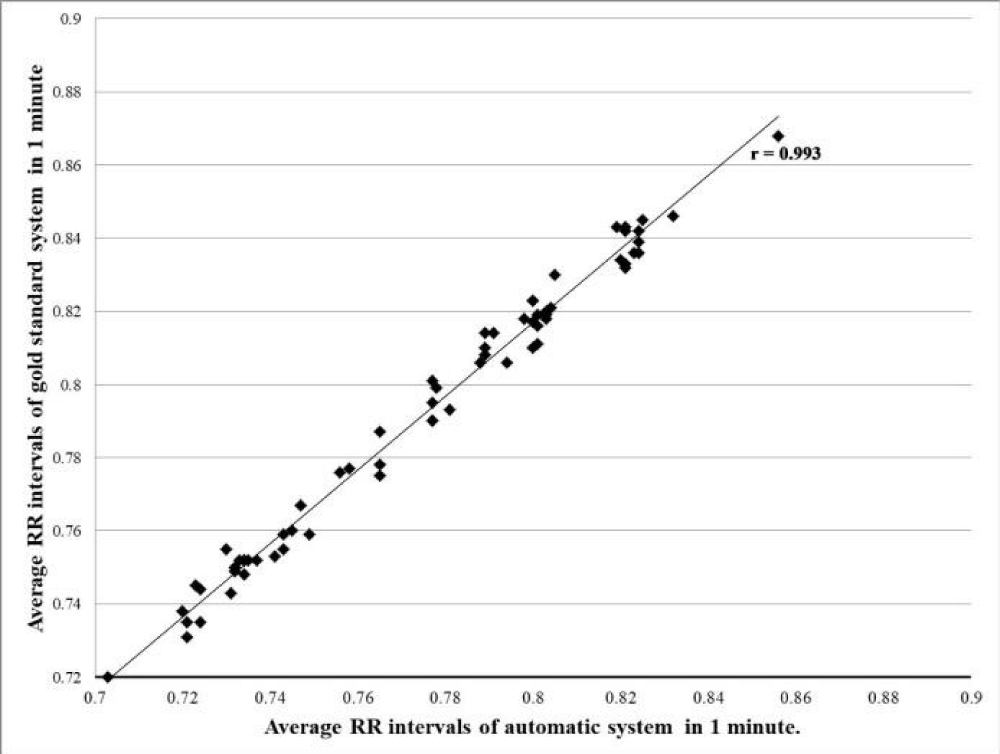
Figure 5: Scatterplot showing the performed measurements of average RR intervals.
Respect the studies [7,9-11], this aim of this research is to present an intuitive ECG device that presents the data in real-time to the patient and that does not require the use of a doctor or expert to understand the ECG values.
The low production costs and the use of open source licenses make an estimated cost of the device of about 150/250 USD.
This paper proposes an automatic low-cost ECG monitoring system which is portable and handy for the use in any environment. The system also implements a connectivity using the Bluetooth module through Arduino which can be used to transmit the data to any Android mobile phone, where a specific application processes the data and extracts the main parameters. The results are displayed in a user-friendly graphical interface that can be easily understood by the patient and through it can be sent to the doctor in any location. Through this system timely monitoring of the heart condition can be done and the abnormality can be detected early of cardiac diseases; also the system is battery operated making it portable for use in any remote places and under any circumstances. The ECG results were verified to an expert doctor and compared with those calculated by a certified medical device. In future, the device can be made wearable through electronic hardware implementation, so to make the subject constantly monitored 24 hours a day without having any impediment or discomfort in his daily actions.
- Braunwald E. Heart Disease: A Textbook of Cardiovascular Medicine. 5th ed., Philadelphia: WB Saunders Co. 1997: 108.
- Naazneen MG, Fathima S, Mohammadi SH, Indikar SIL, Saleem A, et al. Design and Implementation of ECG Monitoring and Heart Rate Measurement System. IJARSE 2013; 2: 2319-5967.
- Anderson RD, Kumar S, Parameswaran R, Wong G, Voskoboinik A. et al. Differentiating Right- and Left-Sided Outflow Tract Ventricular Arrhythmias. Circ Arrhythm Electrophysiol. 2019; 12: e007392. PubMed: https://www.ncbi.nlm.nih.gov/pubmed/31159581
- Shokoueinejad M, Chiang M, Lines F. Wang F, Tompkins W, et al. Systematic Design and HRV Analysis of a Portable ECG System Using Arduino and LabVIEW for Biomedical Engineering Training. IJEEE 2017; 5: 301-311.
- Martinez-Millana A, Palao C, Fernandez-Llatas C, de Carvalho P, Bianchi AM, et al. Integrated IoT intelligent system for the automatic detection of cardiac variability. Conf Proc IEEE Eng Med Biol Soc. 2018; 5798-5801. PubMed: https://www.ncbi.nlm.nih.gov/pubmed/30441653
- Das S, Pal S, Mitra M. Arduino-based noise robust online heart-rate detection. J Med Eng Technol. 2017; 41: 170-178. PubMed: https://www.ncbi.nlm.nih.gov/pubmed/28078906
- Mishra A, Chakraborty B. AD8232 based Smart Healthcare System using Internet of Things (IoT). IJERT. 2018; 7.
- Shokoueinejad M, Chiang M, Lines S, Wang F, Tompkins W, et aL. Systematic Design and HRV Analysis of a Portable ECG System Using Arduino and Lab View for Biomedical Engineering Training. IJEEE. 2017; 5: 301-311.
- Bhimasen K, Pranjal P, Parbej K, Vinay B. Design and Implementation of Low Cost ECG Monitoring System and Analysis using Smart. IJARSET. 2018; 6: 1025-1029.
- Harini R, Rama Murthy B, Tanveer Alam K. Development of ECG monitoring system using Android app. IJEEE. 2017; 9: 699-707.
- Satija U, Ramkumar B, Sabarimalai Manikandan M. Real-Time Signal Quality-Aware ECG Telemetry System for IoT-Based Health Care Monitoring. Ieee Internet of Things Journal. 2017; 4: 815-823.
- Wahane V, Ingole PV. An Android-based wireless ECG monitoring system. IEEE Healthcare Innovation Point-Of-Care Technologies Conference. Dic. 2016: 183-187
- Vargas Escobar LJ, Salinas SA. e-Health prototype system for cardiac telemonitoring. Conf Proc IEEE Eng Med Biol Soc. 2016; 4399-4402.PubMed: https://www.ncbi.nlm.nih.gov/pubmed/28269253
- Zheng L, Tai C. Detection of ECG characteristic points using wavelet transforms. Ieee T Bio-Med Eng. 1995; 42: 21-28.
- Shokoueinejad M, Fernandez C, Carroll E, Wang F, Levin J, et al. Sleep apnea: A review of diagnostic sensors, algorithms, and therapies. Physiological Measurement. 2017; 38: R204- R252. PubMed: https://www.ncbi.nlm.nih.gov/pubmed/28820743
- Awal MA, Mostafa SS, Ahmad M, Rashid MA. An adaptive level dependent wavelet thresholding for ECG denoising. Biocybern Biomed Eng. 2017; 34: 238-249.
- Xu MF, Wei SS, Qin XW. et al. Rule-based method for morphological classification of ST segment in ECG signals. J Med Biol Eng. 2015; 35: 816–823.
- Pan J, Tompkins WJ. A real-time QRS detection algorithm. Ieee T Bio-Med Eng. 1985; 230-236. PubMed: https://www.ncbi.nlm.nih.gov/pubmed/3997178
- Tompkins WJ. Biomedical Digital Signal Processing. Editorial Prentice Hall. 1993.